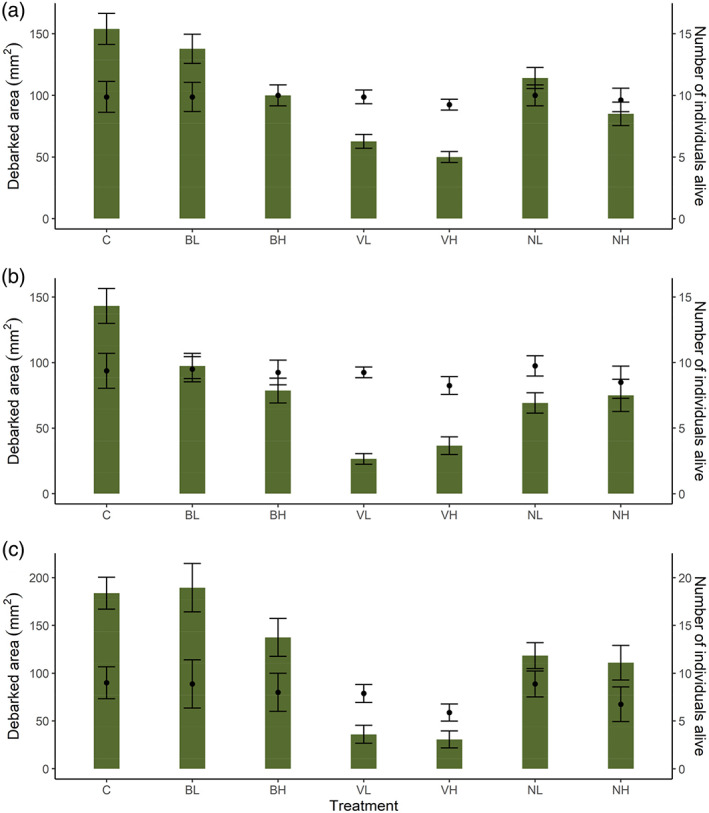
Figure 1.

Mean area debarked (mm2) per surviving weevil ± standard error (green bars), per treatment when Hylobius abietis was exposed to (a) 3 days and (b) 7 days of Bt‐treated food and (c) an additional 7 days of non‐Bt treated food (stem pieces of Picea abies). Mean number of individuals (± standard error) that were alive at that time period for each treatment (averaged across 4 rounds, n per round = 10), is also shown (black dots). Total area debarked per treatment (Fig. S1) was divided by the mean number of individuals alive at each time point to obtain area debarked per weevil per treatment. Treatments are abbreviated as follows: control (C), Bt galleriae formulation (low and high concentration: BL, BH), Bt israelensis (VL, VH), Bt tenebrionis (NL, NH).
