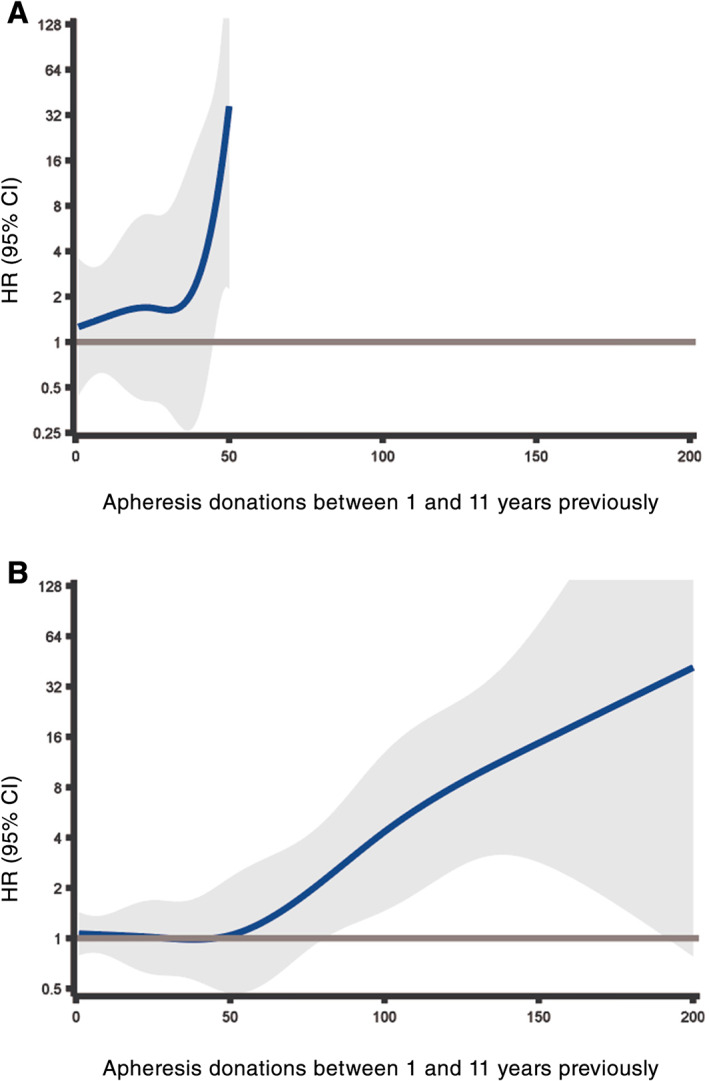
FIGURE 2.

Risk of infections comparing LRS donations to non‐LRS donations, in relation to number of past donations between 1 and 11 years previously modeled as a restricted cubic spline. A, Immunosuppression‐related infections. B, Common bacterial infections. The range of the y axes is restricted to 128 for legibility [Color figure can be viewed at wileyonlinelibrary.com]
