
FIGURE 3.
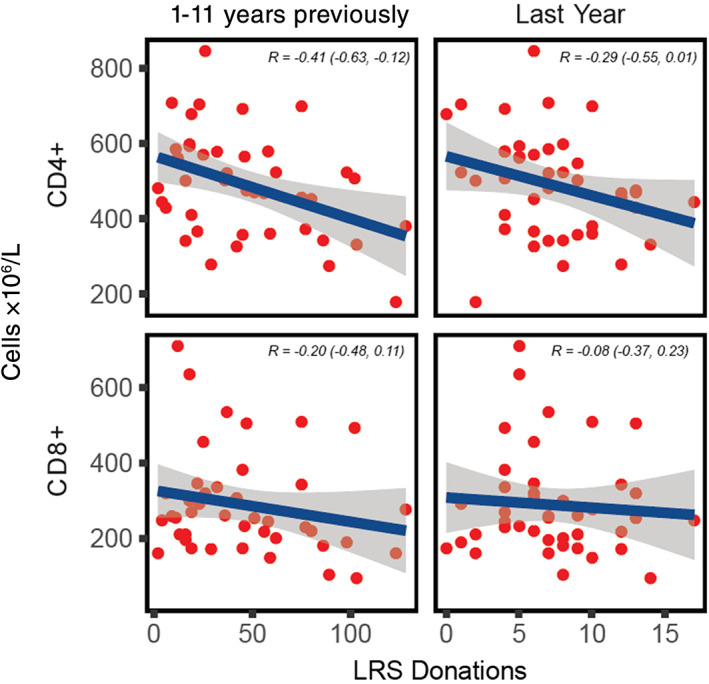
CD4+ and CD8+ T‐cell counts in frequent apheresis donors. The horizontal axis shows number of LRS donations between 1 and 11 years previously (left) and LRS donations in the past year (right). Blue line depicts mean and the gray band depicts 95% CI for the mean. R depicts the Pearson correlation (95% CI) [Color figure can be viewed at wileyonlinelibrary.com]