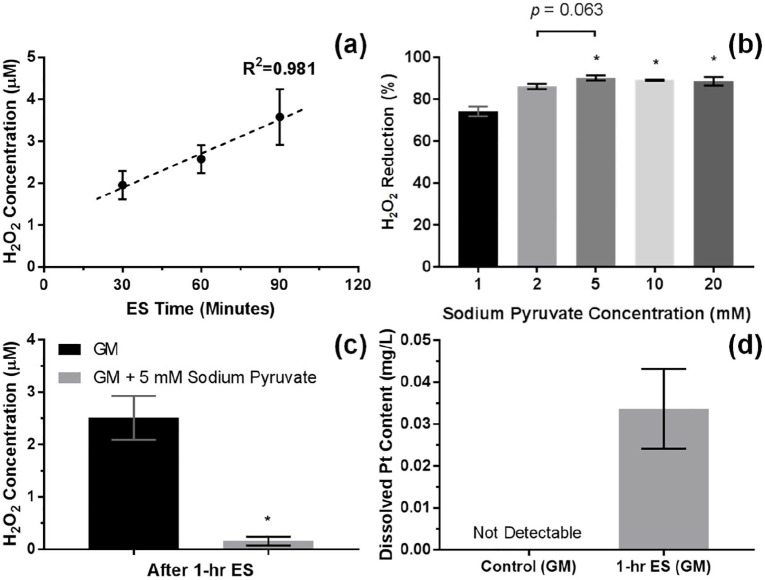
Figure 4.
(a) H2O2 concentration of the acellular growth media (GM) in function of the electrical stimulation (ES) time. Error bars represent SD (n = 6 replicates), and dash line represents linear trend line. (b) The reduction in H2O2 concentration of the acellular GM after 1 h of ES by sodium pyruvate ranging from 1 to 20 mM relative to 0 mM. Error bars represent SD (n = 3 replicates). * represents p < 0.05 (one-way ANOVA with Tukey’s pairwise comparison) when compared with 1 mM. (c) H2O2 concentration of the acellular GM after 1 h of ES without and with 5 mM sodium pyruvate. Error bars represent SD (n = 3 experiments). *represents p < 0.05 (unpaired two-tailed Student’s t-test) when compared with GM without sodium pyruvate. (d) Measured dissolved Pt content in the acellular GM after 1 h of ES using ICP-MS. Error bars represent SD (n = 3 experiments).

