
Fig. 5: ABNs distinguish between diseased and healthy mice.
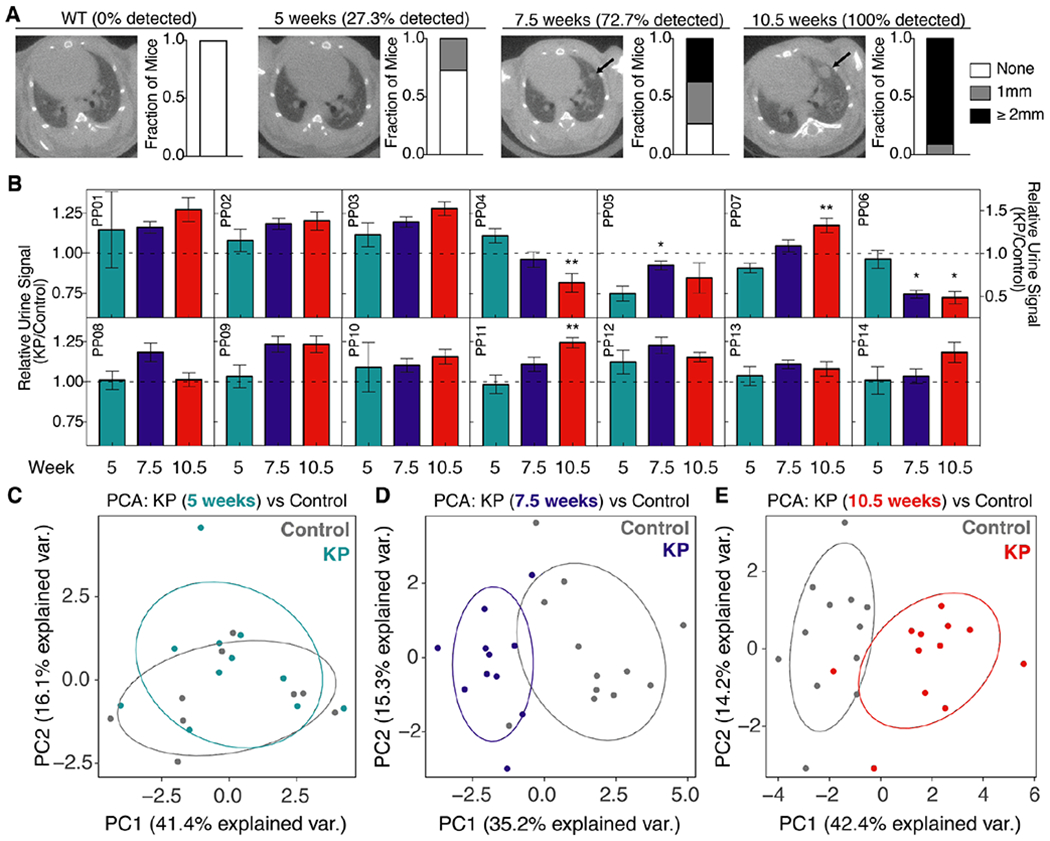
(A) Tumor development was monitored by microCT in healthy (left, n = 11) and KP mice at 5 weeks (n = 11), 7.5 weeks (n = 11), and 10.5 weeks (n = 11) after tumor induction. Right three panels represent time series of a single mouse, with arrow indicating development of a single nodule over time. Size of the largest tumor nodule was assessed by a blinded radiation oncologist (quantification at right of each image). (B) ABNs were administered to KP and control animals at 5 weeks (KP: n = 11; Control: n = 9), 7.5 weeks (KP: n = 11; Control: n = 12), and 10.5 weeks (KP: n = 12; Control: n = 12) after tumor initiation, bladder was voided at 1 hr, and urine was collected and pooled over the following 1 hour interval. LC-MS/MS was performed, peak area ratio (PAR, peak area of reporter divided by peak area of spiked-in internal standard) was calculated, and all reporters were mean normalized within each sample. Y axis represents for each reporter at each time point. For clarity, PP06 is presented on a larger scale y axis. Asterisks indicate significant differences from 5 weeks. * Padj < 0.05, ** Padj < 0.01; by two-tailed t-test with adjustment for multiple hypotheses using the Holm-Sidak method. Error bars represent SEM. (C-E) Unsupervised clustering by principal component analysis (PCA) was performed on mean normalized MS data for KP mice and controls at 5 weeks (C), 7.5 weeks (D), and 10.5 weeks (E).