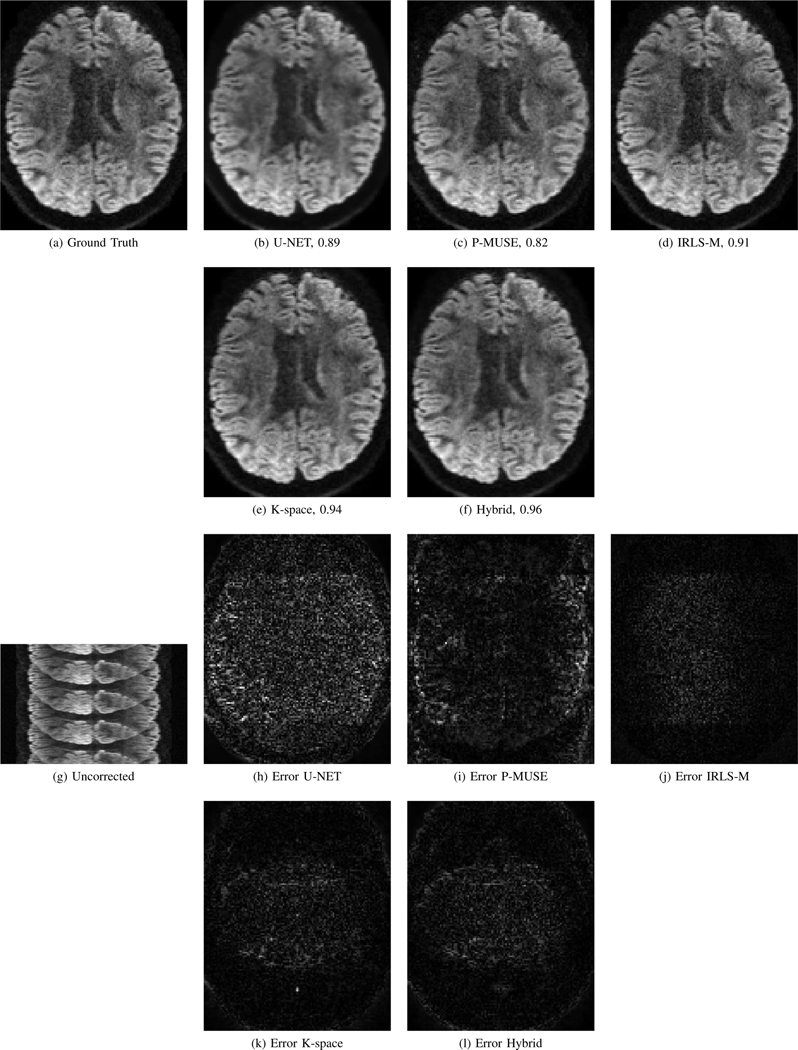
Fig. 8.
Simulation results using the high-SNR data obtained from HCP. The reconstructed images and the corresponding error maps from five different algorithms are shown. Here, the ground truth is an image from the test dataset that was corrupted with phase errors of bandwidth 3×3 and noise standard deviation σ = 0.001 to simulate 4 shot acquisition. (g) shows the uncorrected image if we do not correct the phase errors during reconstruction. The numbers in the sub-captions represent the SSIM values.

