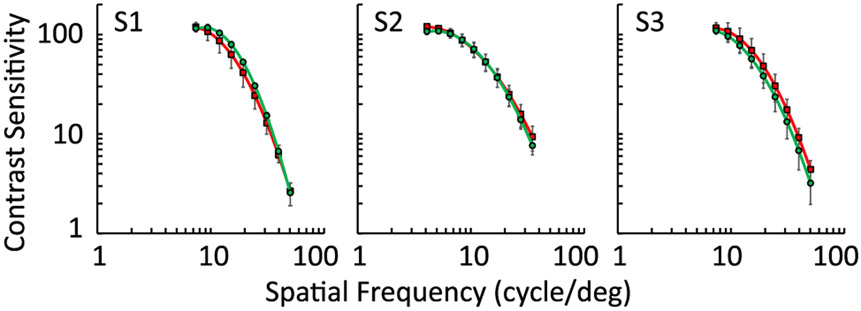
Fig. 4.
Averaged contrast sensitivity functions (CSFs) for 661 and 532 nm channels for three subjects, S1, S2, and S3, after the LCA compensation. Red and green curves represent the 661 nm and 532 nm channels, respectively. Both channels achieved an excellent and similar contrast sensitivity performance, indicating the optimal correction of LCA.

