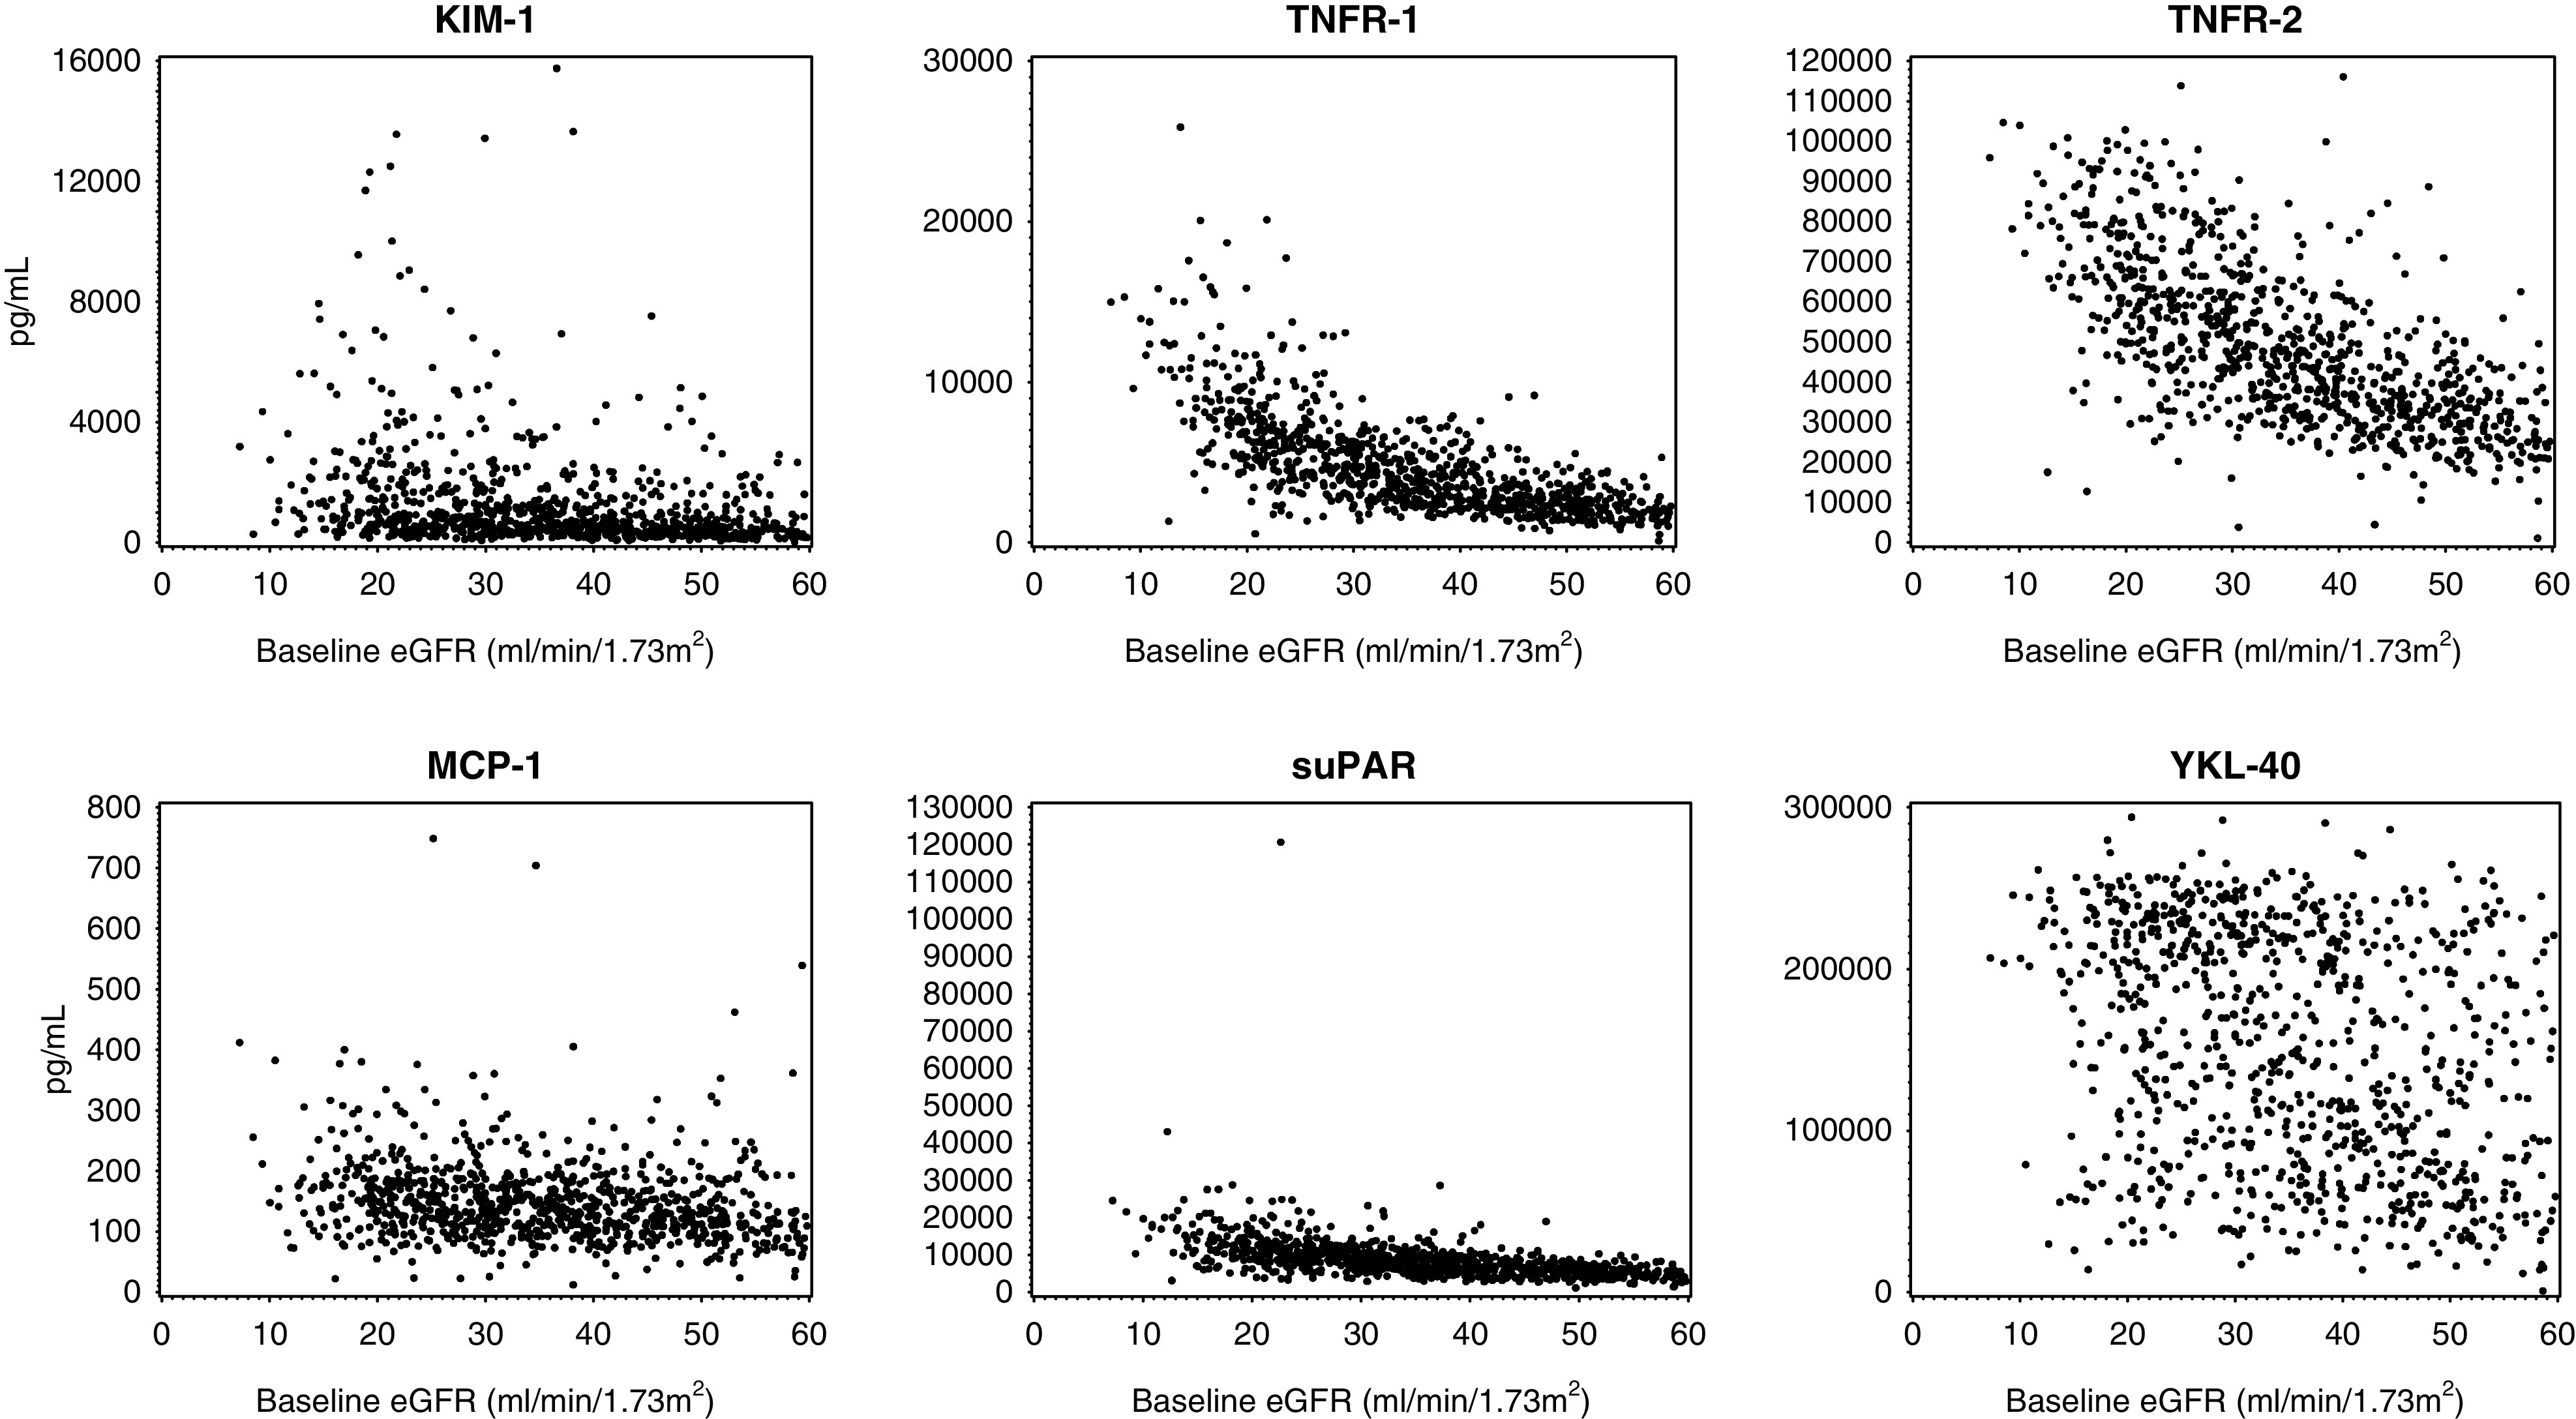
Figure 1.

Scatterplot of plasma biomarker concentrations (pg/ml) on y axis were consistenty higher among those with lower baseline eGFR (ml/min per 1.73 m2) values on x axis. Top row (left to right): KIM-1, TNFR-1, and TNFR-2. Bottom row (left to right): MCP-1, suPAR, and YKL-40.
