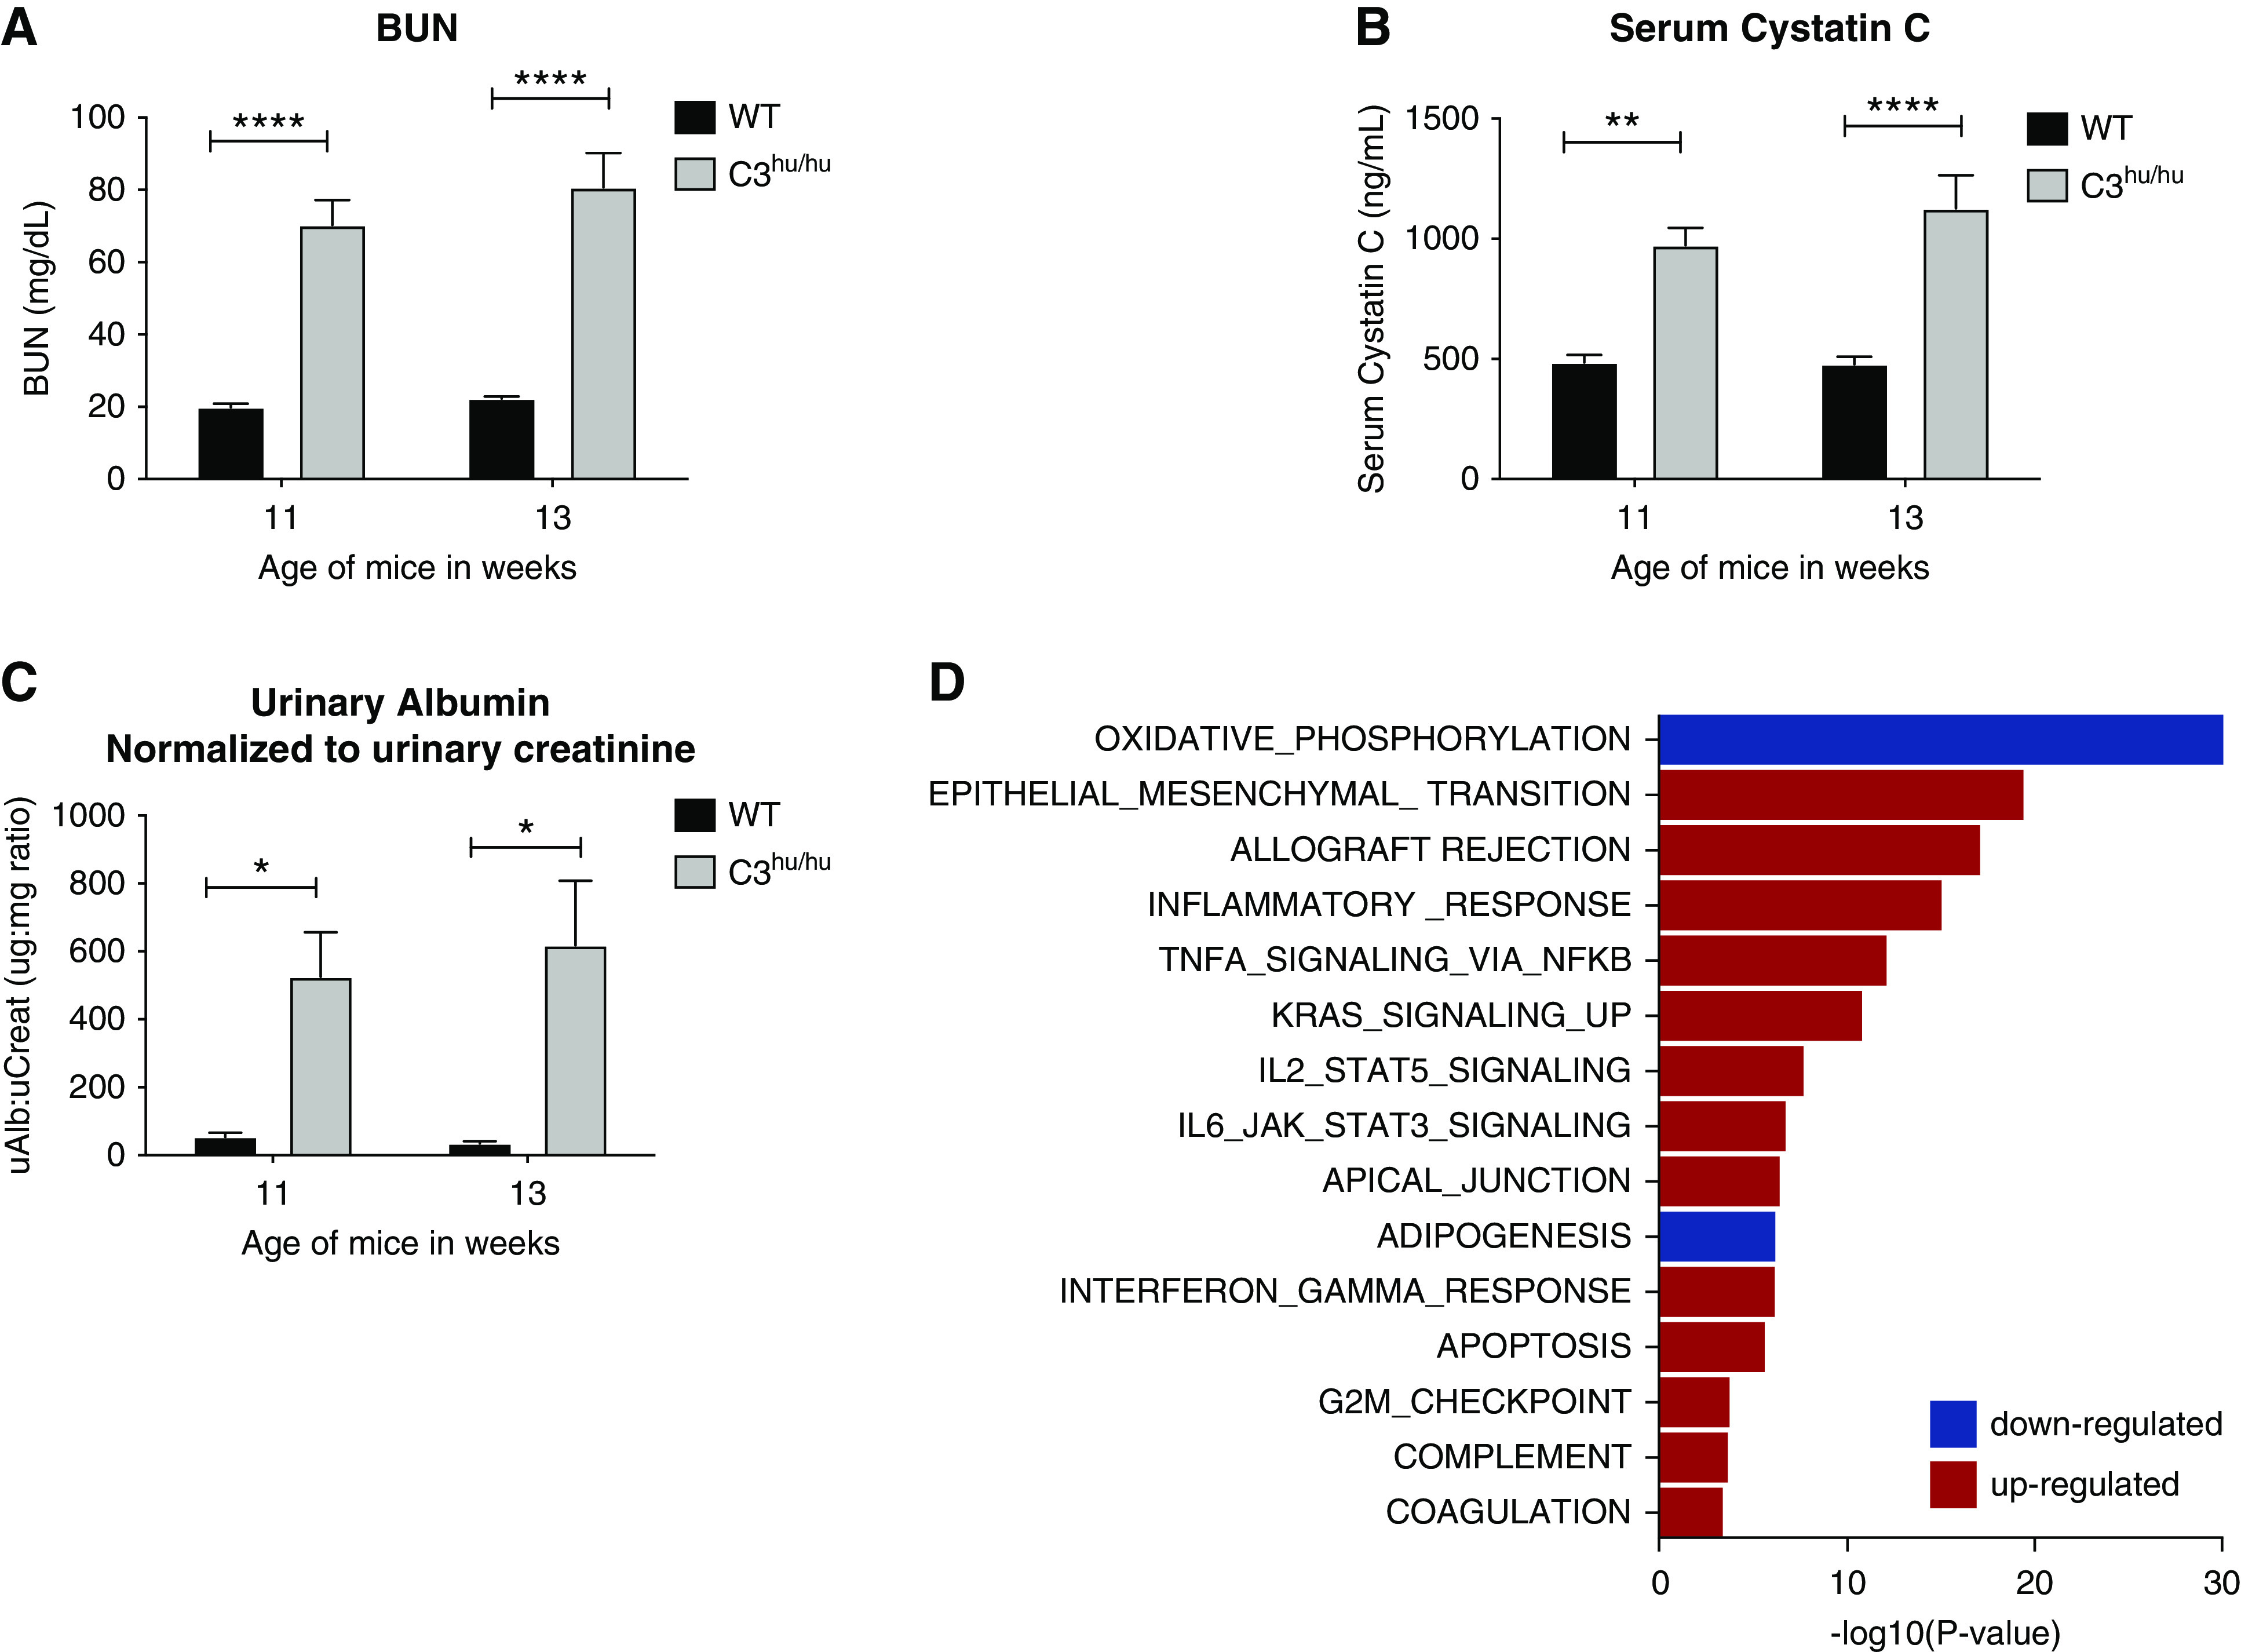
Figure 4.

Functional and molecular characteristics of C3hu/hu mice. (A and B) Graphs depicting the results of BUN and sCysC, respectively, in WT (n=6) and C3hu/hu mice (n=9). (C) Graph depicting the results of urinary albumin per day and urinary albumin normalized to creatinine, respectively, in WT (n=6) and C3hu/hu mice (n=9). (D) Gene-set enrichment analysis31 of genes differentially expressed between C3hu/hu mice and their WT controls. Graph shows subset of the MsigDB hallmark gene sets with adjusted P value for enrichment <10−3. uAlb, urinary albumin; uCreat, urinary creatinine. *P<0.05, **P<0.01, ****P<0.0001.
