
Figure 7.
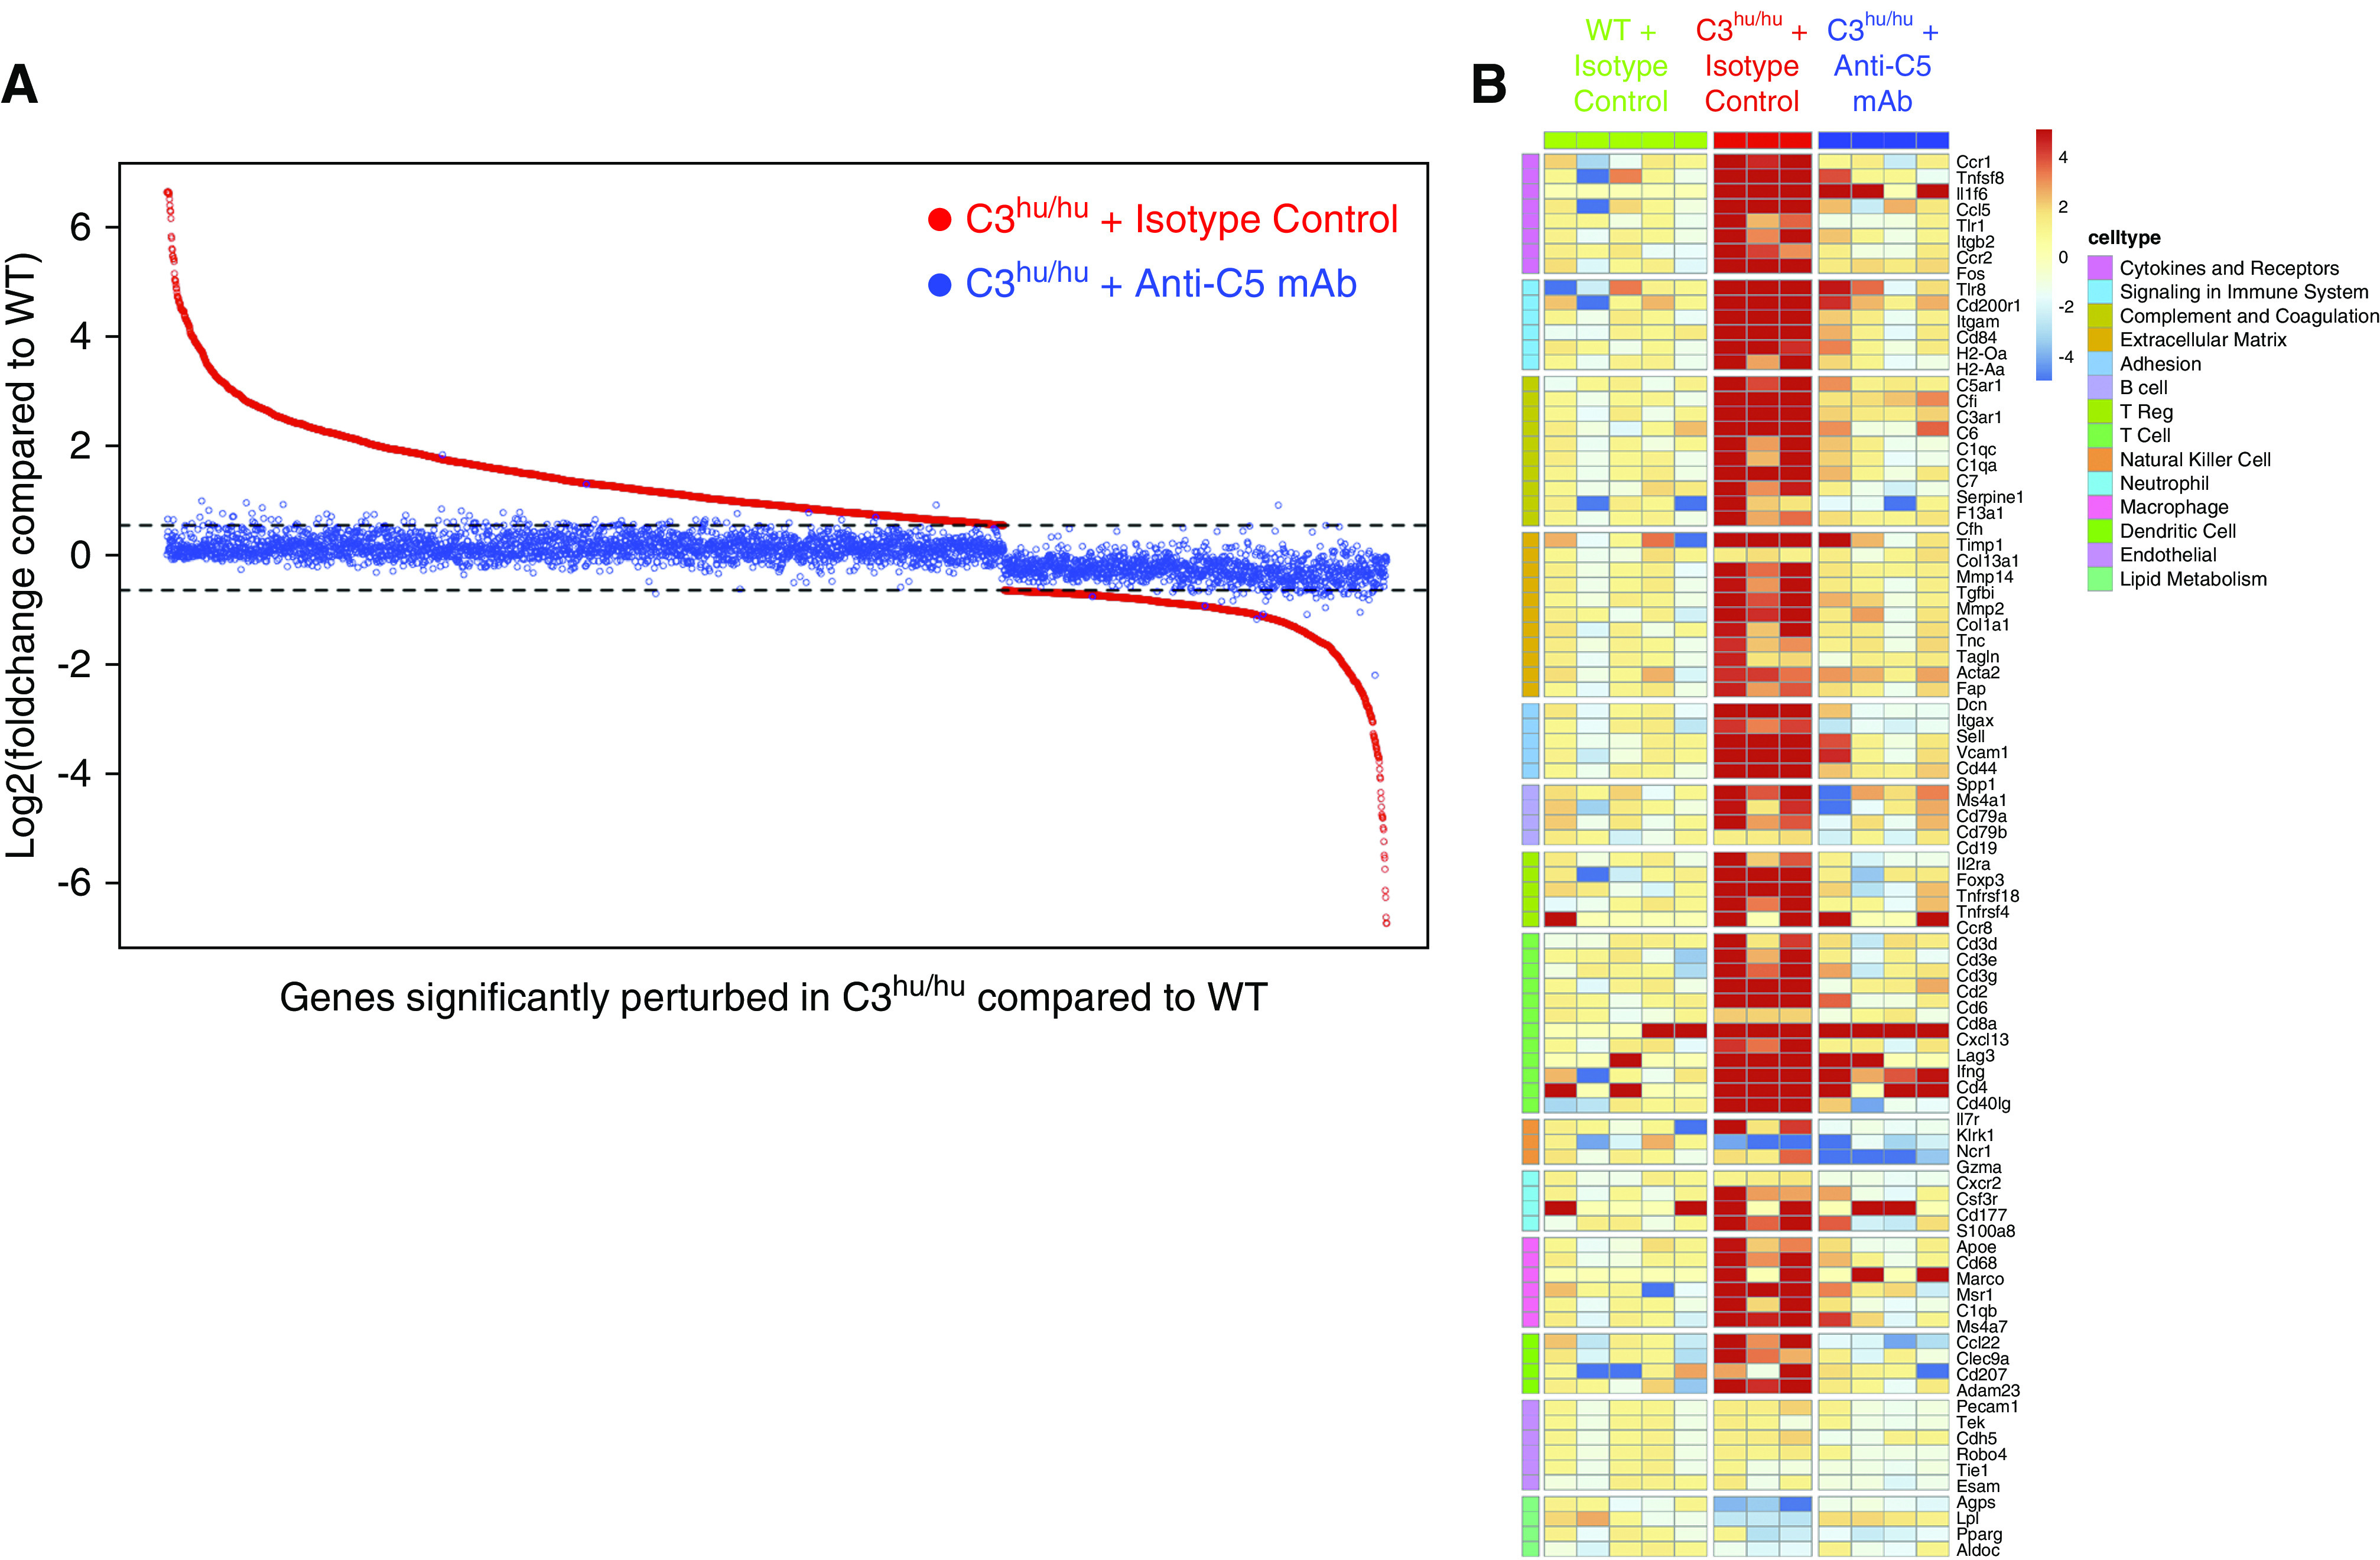
Anti-C5 mAb rescues molecular signature in C3hu/hu mice. (A) Scatterplot demonstrating that anti-C5 antibody treatment reversed disease signature genes in C3hu/hu mice. Shown are log2 fold changes of all 3443 genes differentially expressed between isotype-treated C3hu/hu and WT mice (red dots), sorted by diminishing fold change. Each gene’s corresponding fold change when comparing C5 mAb-treated C3hu/hu mice with WT is plotted in blue at the same position along the x axis. Horizontal dotted lines indicate 50% up- or downregulation, corresponding to our fold change cutoff for identifying differential expression. (B) Heatmap showing representative genes (rows) for perturbed pathways and immune cell types. Each column represents an individual animal, and each cell represents an individual gene-expression measurement, normalized separately for each gene to the median of WT controls. Red and blue colors represent up- and downregulated genes, respectively. All pathways (although not all genes) of interest were perturbed in the C3hu/hu and isotype control mice, and then subsequently attenuated by anti-C5 mAb treatment.