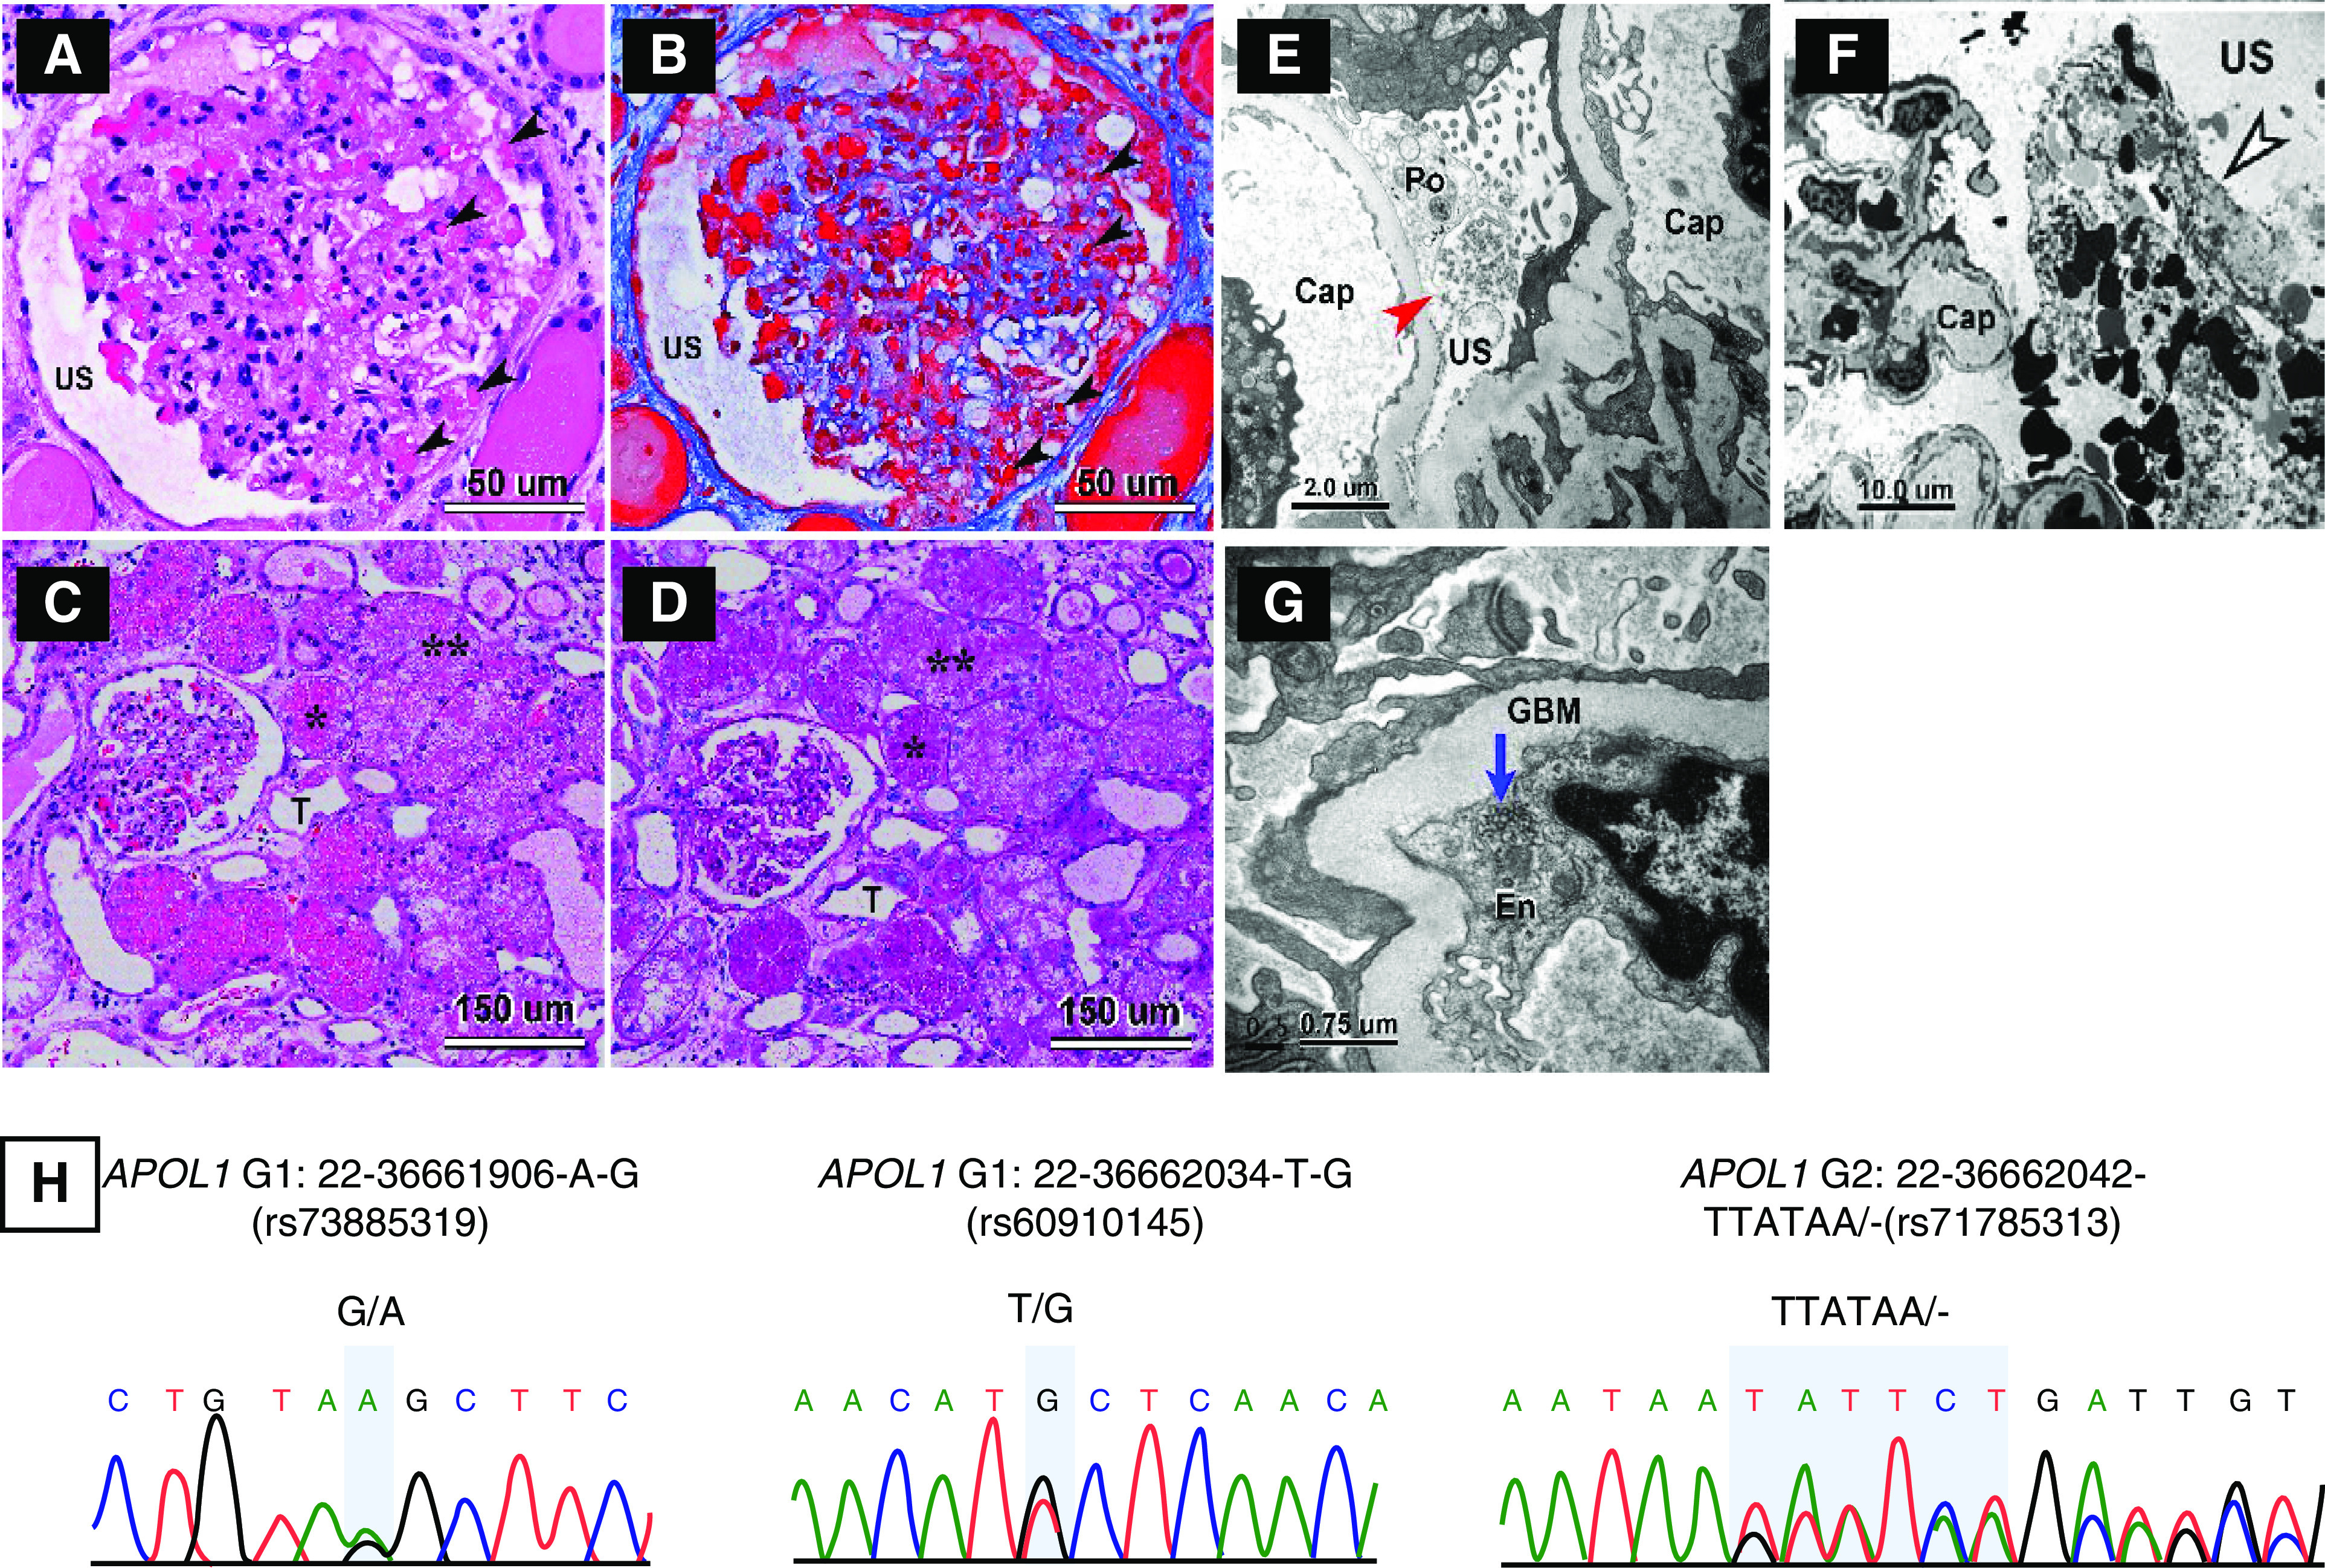
Figure 1.

Biopsy findings showing CGN and APOL1 genotyping showing high risk genotype for patient 1. (A–D) Light micrographs of glomerular and tubular morphologic features in patient’s renal biopsy. (A and B) Mild to moderate focal glomerular hypercellularity with shrinkage of the capillary tuft is seen. The lumina of many capillary loops are effaced. The urinary space (US) is expanded. Many protein absorption lysosomal droplets are seen in the glomerular podocytes and parietal epithelial cells (black arrowheads). (A and C) Hematoxylin and eosin stain. (B) Trichrome stain. (D) Periodic acid–Schiff (PAS) stain. T, tubule. *In (C and D), numerous protein absorption lysosomal PAS-positive droplets are seen in the tubular epithelia. **Many tubules have undergone severe vacuolar degeneration. (E–G) Electron micrographs of glomerular and tubular morphologic features in patient’s renal biopsy. (E and F) Podocyte effacement (Po) and dilation of USs (red arrow) with cellular debris are present in the US (black and white arrowhead), which is likely made up of deformed red blood cells and fibrin tactoids. (G) shows tubular reticular inclusions (TRIs) in the rough endoplasmic reticulum of glomerular endothelium (En; blue arrow). GBM, glomerular basement membrane. (H) Sequencing for APOL1 was performed on DNA obtained from blood and native kidney biopsy. Genotypes were concordant and revealed a high–renal risk APOL1 G1/G2 genotype.
