
Figure 1.
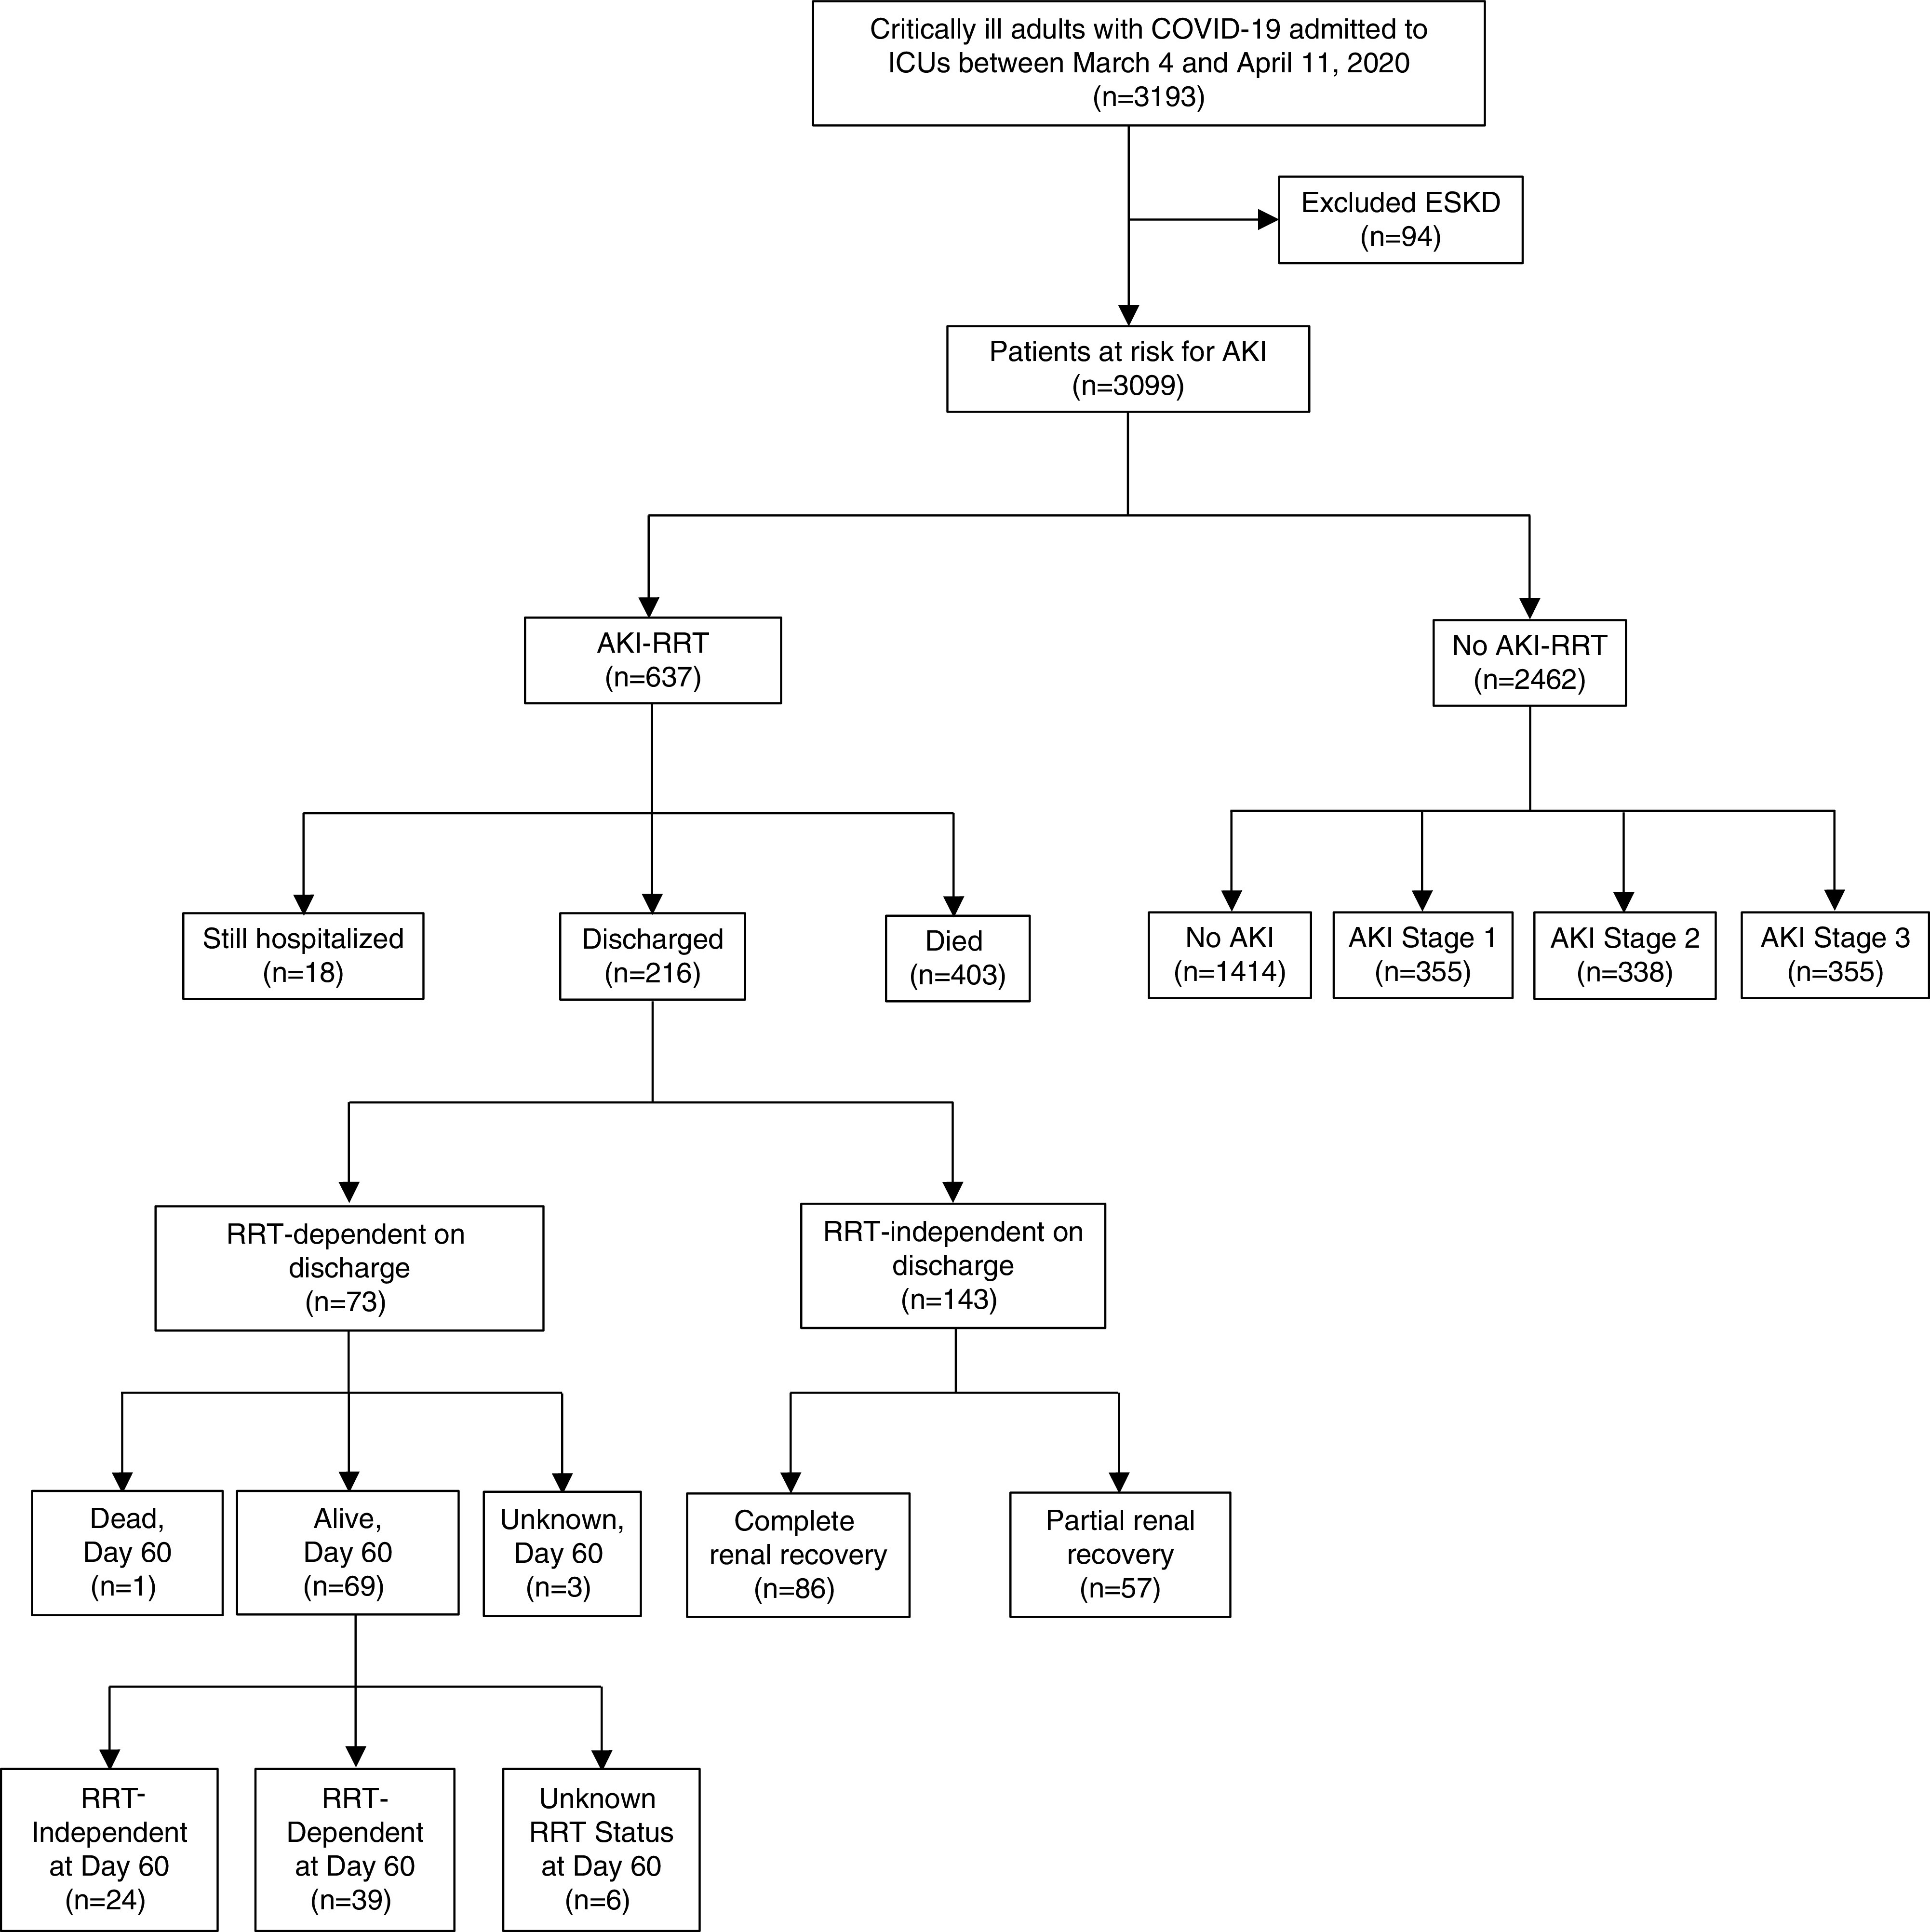
Flowchart of study population. This figure shows the number of patients with and without AKI-RRT and, among those with AKI-RRT, the number of patients who died, were discharged, and were still hospitalized at last follow up.
Official websites use .gov
A
.gov website belongs to an official
government organization in the United States.
Secure .gov websites use HTTPS
A lock (
) or https:// means you've safely
connected to the .gov website. Share sensitive
information only on official, secure websites.
Flowchart of study population. This figure shows the number of patients with and without AKI-RRT and, among those with AKI-RRT, the number of patients who died, were discharged, and were still hospitalized at last follow up.