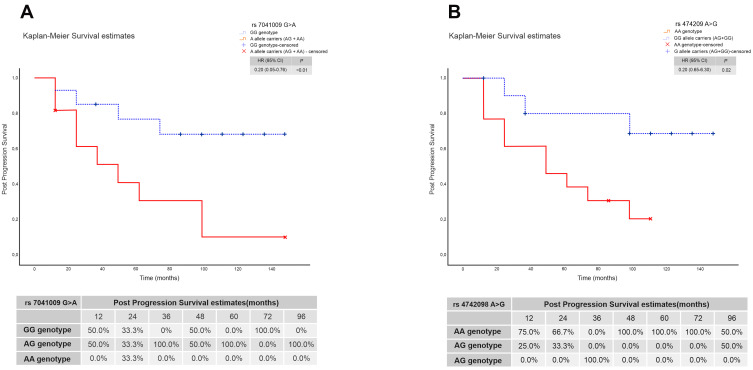
Figure 2.
Kaplan–Meier survival curves estimating post-progression survival (PPS) in NSCLC patients according to PD-L1 polymorphisms. (A) Kaplan–Meier survival curve for rs7041009 G>A. A allele carriers (AG+AA) presented worse prognosis and a lower PPS rate when compared GG genotyped patients (P<0.01); (B) Kaplan–Meier survival curve for rs4742098 A>G. G allele carriers (AG+GG) had a higher PPS rate and better prognosis when compared AA genotyped patients (P=0.02).

