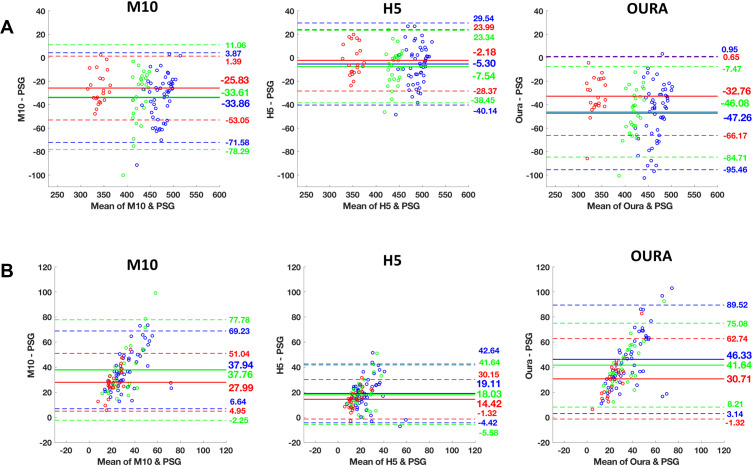
Figure 1.
Bland−Altman plots of mean bias with upper and lower bands of agreement between polysomnography (PSG), Oura and Actiwatch H5 and M10 settings for each TIB condition (Red: 6.5-hour, green: 8-hour, and blue: 9-hour). A mean bias line above and below zero demonstrates overestimation and underestimation of the device against PSG, respectively. Bland-Altman plots of (A) total sleep time (TST), and (B) wake after sleep onset (WASO) for Actiwatch M10, H5, and Oura, respectively. The solid line indicates the mean value of bias and the dashed line represent 1.96 SD limits of agreement.

