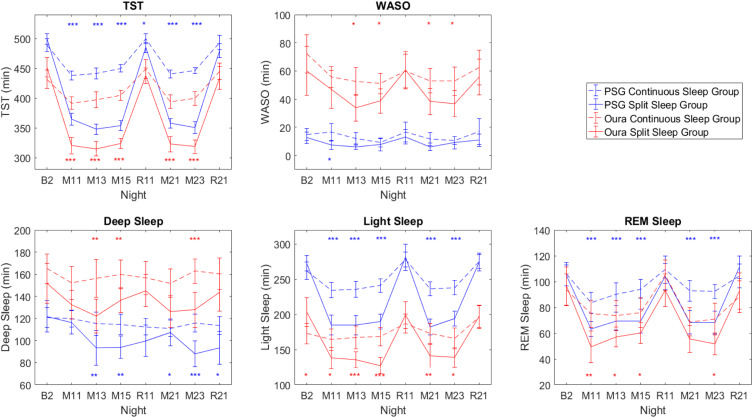
Figure 3.
TST, WASO, and sleep stages measured by PSG (blue lines) and Oura ring (red lines) for the Continuous (dotted lines) and Split (solid lines) sleep groups across the manipulation nights. Error bars denote 95% confidence intervals. Blue asterisks denote significant differences between groups with PSG measures, while red asterisks denote significant differences between groups with Oura measures. *P < 0.05; **P < 0.01; ***P < 0.001.

