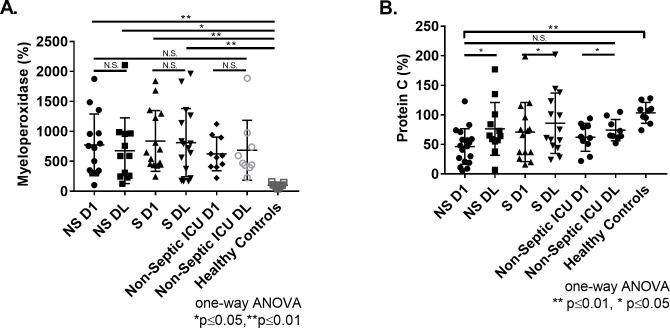
Fig 3. Comparison of Myeloperoxidase and Protein C in ICU patient samples.
(A) MPO levels in non-survivor septic (NS), survivor septic (S), non-septic, and healthy controls at day 1 and day last. (B) Protein C levels in non-survivor septic, survivor septic, non-septic, and healthy controls at day 1 and day last. MPO and Protein C values normalized to pooled healthy control plasma and expressed as a percentage (mean±SD). Dunnett’s multiple comparisons test (one-way ANOVA). Paired t-test performed to assess change between Day 1 and Day Last. ****p≤0.0001, ***p≤0.001, **p≤0.01, *p≤0.05, and N.S. p>0.05.

