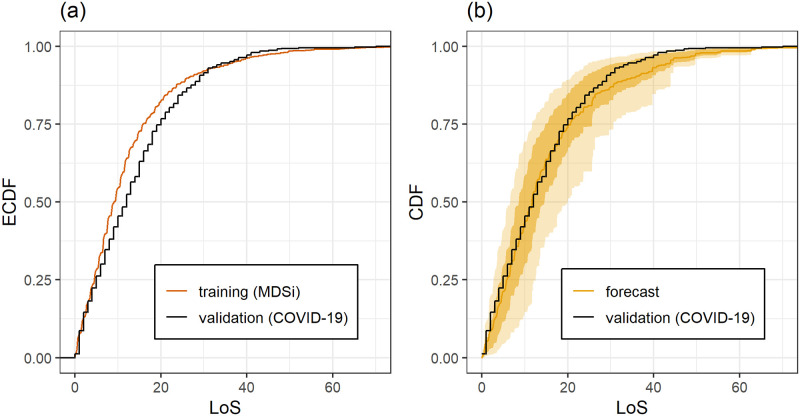
Fig 2.
(a) EmpiricalCDF of the LoS in training and validation dataset. (b) Empirical CDF of the LoS in the validation dataset (black step function black, same as in panel (a)) and average LoS forecast for the COVID-19 patients (orange curve). Shaded areas show the pointwise 25% and 75% (10% and 90% for the outer bounds) quantiles of the predictive CDFs. For the average LoS forecast, the predictive CDFs of the COVID-19 patients are averaged pointwise, that is, the curves show the vertical average of the predictive CDFs for all patients in the COVID-19 dataset. The computation of the aggregated LoS CDFs is demonstrated in the sample code in S1 Code. The predictions take individual patient covariates into account and this allows to mitigate some differences between training and validation data observed in panel (a); for further discussion see text.

