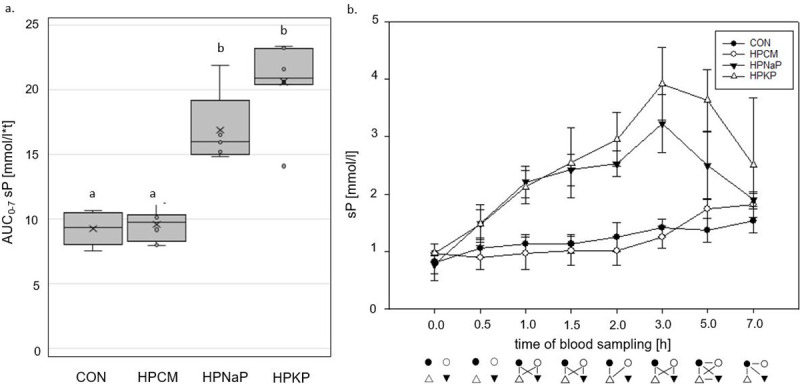
Fig 1. Serum P (sP) concentrations.

a. Area under the curve from 0 until 7 hours postprandially (AUC0-7) of sP [mmol/l*t] in adult dogs fed a control diet and 3 different high P diets for 18 days. Boxes not sharing a superscript letter are significantly different (p<0.05) b. Kinetics from 0 to 7 hours postprandially of sP [mmol/l] in adult dogs fed a control and 3 different high P diets. Connected symbols below the graph are significantly different (p<0.05) at the corresponding time point. Reference range for healthy adult dogs: 0.7–1.6 mmol/l [85].
