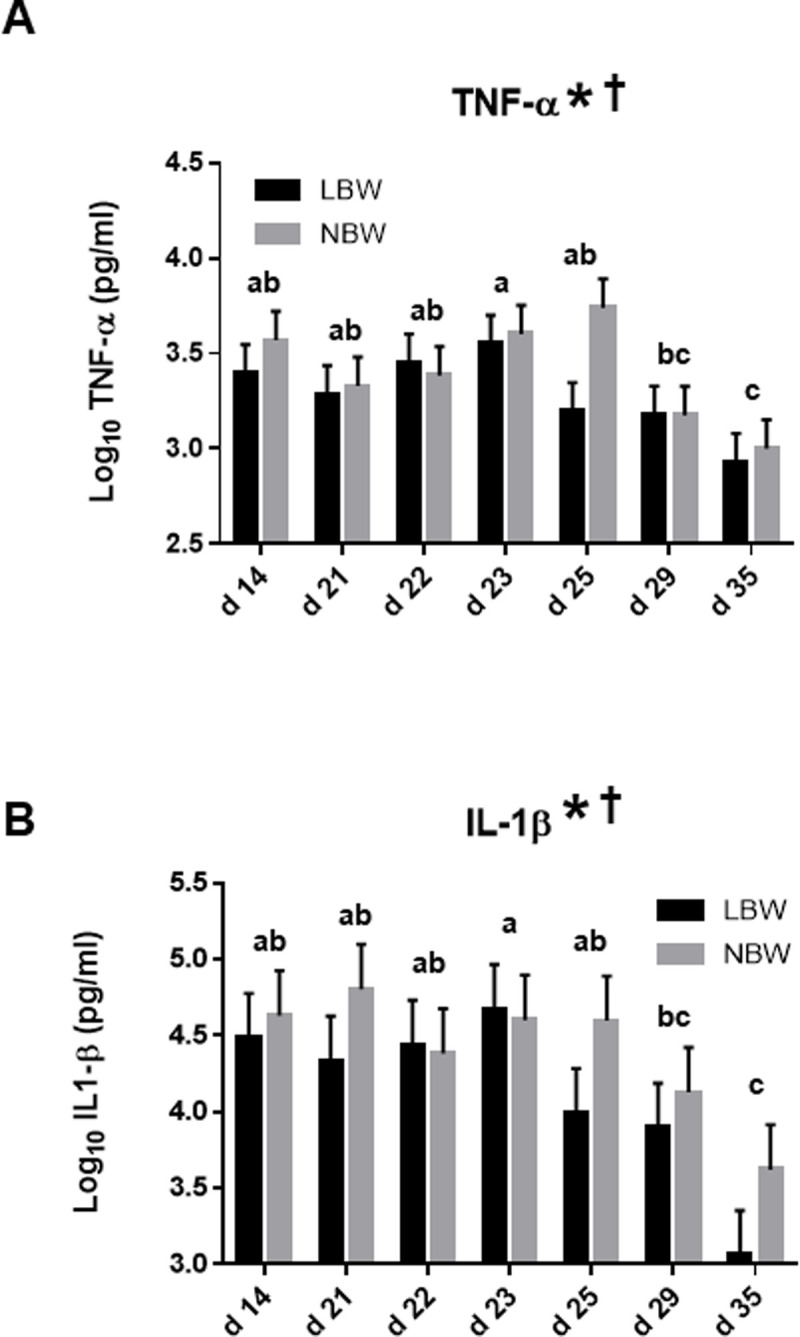
Fig 4. Levels of TNF-α and IL-1β in plasma samples of LBW and NBW piglets of different ages throughout the peri-weaning period.

Bars in the graphs represent Log10 means ± SEM of 10 piglets of TNF-α (A) and IL-1β (B) in plasma samples. Asterisk (*) indicates a significant effect of the age on means at P ≤ 0.05. Dagger (†) indicates a significant effect of the birth weight on means at P ≤ 0.05. Ages with different letters (a, b, c) within the graphs are statistically different at P ≤ 0.05. Detailed P-Values for main effects and interactions are available in S15 Table in S1 File, comparative analysis with litter and gender as random cofactors in S16 Table in S1 File and box plot of data distribution in S5 Fig in S1 File. TNF-α = Tumor necrosis factor-α; IL-1β = Interleukin-1β.
