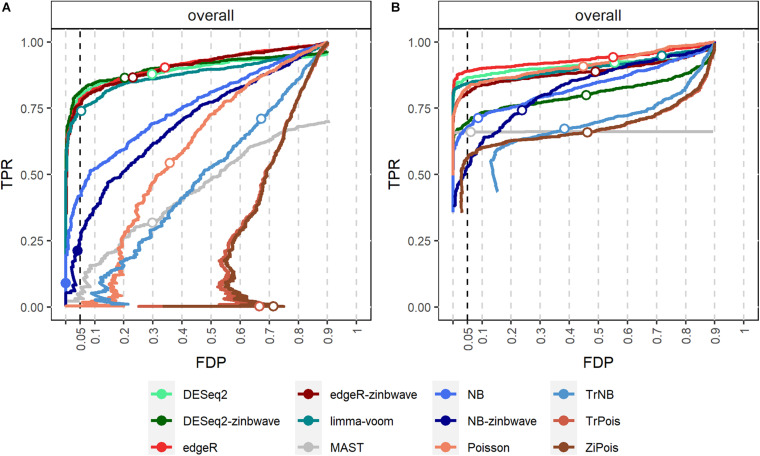
FIGURE 2.
FDP-TPR curves of DE methods on simulated Usoskin datasets and Tung datasets. (A) Line plot of the FDP-TPR curves for simulated Usoskin datasets generated by splatter for each of 12 DE methods. (B) Line plot of the FDP-TPR curves for simulated Tang datasets generated by splatter for each of 12 DE methods. Circles represent values at a 0.05 nominal FDR threshold and are filled in if the FDP (i.e., empirical FDR) is less than 0.05. DE, differential expression; TPR, true positive rate; FDP, false discovery proportion; FDR, false discovery rate.

