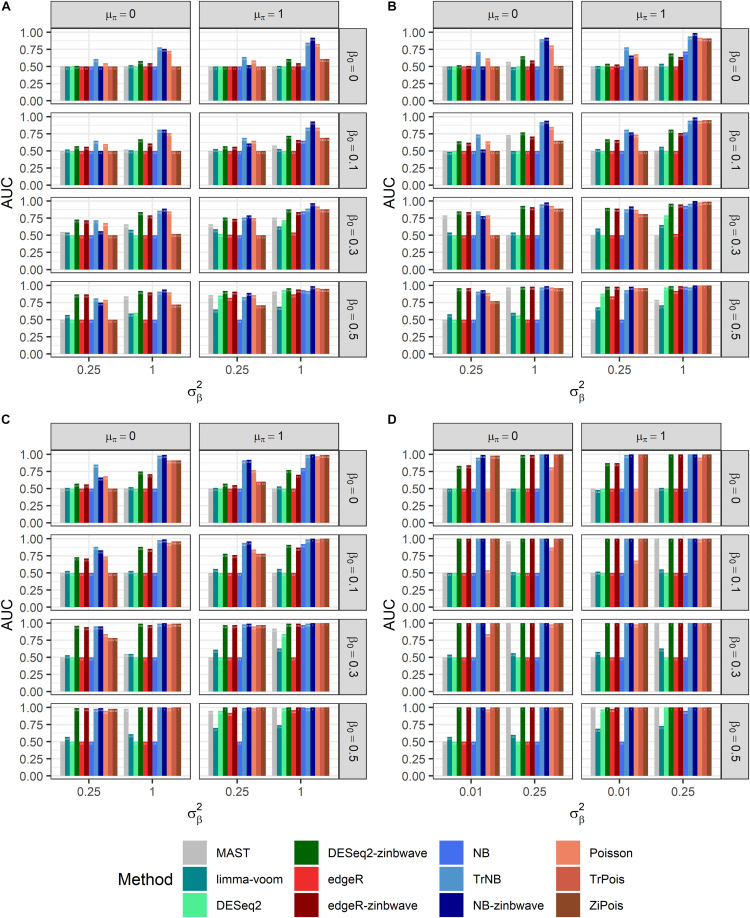
FIGURE 4.
AUCs of DE methods for simulated datasets generated by GLMMs with μπ = 0. Adjusted p-values are used as predictors. (A) Bar plot of AUCs for simulated datasets generated by NB GLMMs for each of 12 DE methods with the dispersion parameter θ = 0.5. (B) Bar plot of AUCs for simulated datasets generated by NB GLMMs for each of 12 DE methods with θ = 1. (C) Bar plot of AUCs for simulated datasets generated by NB GLMMs for each of 12 DE methods with θ = 2. (D) Bar plot of AUCs for simulated datasets generated by Poisson GLMMs for each of 12 DE methods. AUC, area under curve; DE, differential expression; GLMM, generalized linear mixed model; NB, negative binomial.

