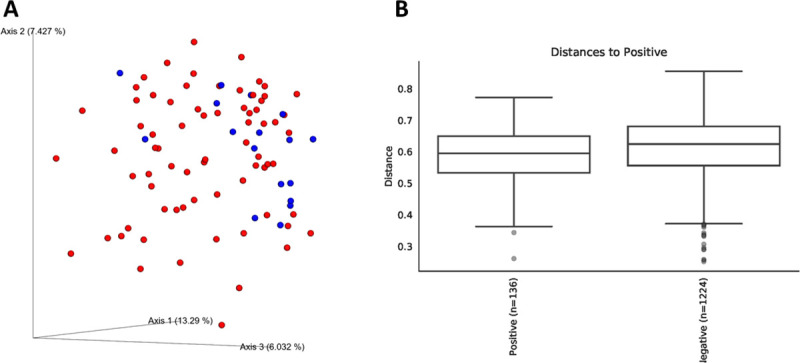
Fig 2. Beta diversity of microbiota from 89 cats tested for naturally occurring infection with T. foetus.

Panel A: Bray-Curtis principal coordinates analysis plot showing clustering of microbial communities from feces of cats testing positive (blue circles) versus negative (red circles) for T. foetus infection. Axis 1, 13.29%; Axis 2, 7.427%; Axis 3, 6.032%. Panel B: Unweighted Unifrac distances between microbial communities from feces testing positive versus negative for T. foetus infection. PERMANOVA q = 0.033.
