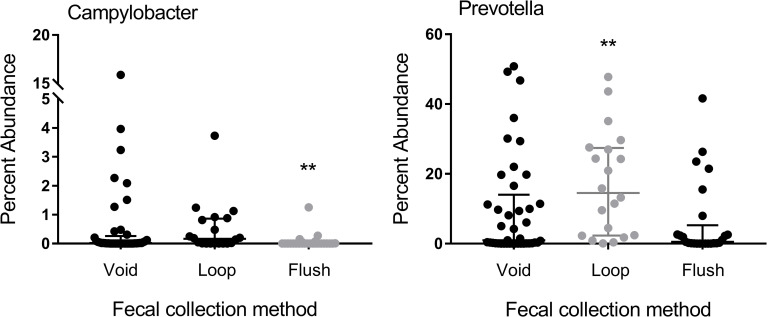
Fig 4. Percent abundance of Campylobacter and Prevotella in feces of cats having the sample collected after voiding (n = 41 cats), using a fecal loop (n = 20 cats), or by means of colonic flush (n = 25 cats).
Data points represent individual cats. Bars represent median and interquartile range. Kruskal-Wallis One Way ANOVA on Ranks **p<0.01 (BH-corrected p = 0.129). BH = Benjamini- Hochberg.

