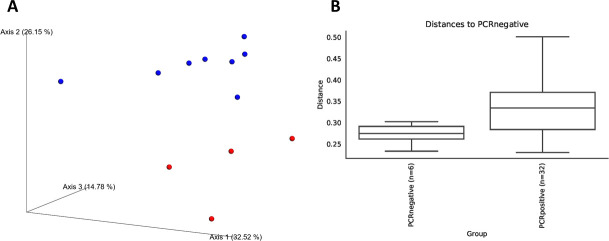
Fig 5. Bray-Curtis beta diversity of microbiota from 4 kittens prior to (PCR negative) and at 2 time points after (PCR positive) experimental infection with feline T. foetus.
Panel A: Principal coordinates analysis plot showing clustering of microbial communities from feces of cats prior to (red circles) and after (blue circles) experimental T. foetus infection. Axis 1, 35.52%; Axis 2, 26.15%; Axis 3, 14.78%. Panel B: Weighted Unifrac distances between microbial communities from feces of cats prior to (PCR negative) and after (PCR positive) experimental T. foetus infection. Bray-Curtis PERMANOVA q = 0.003.

