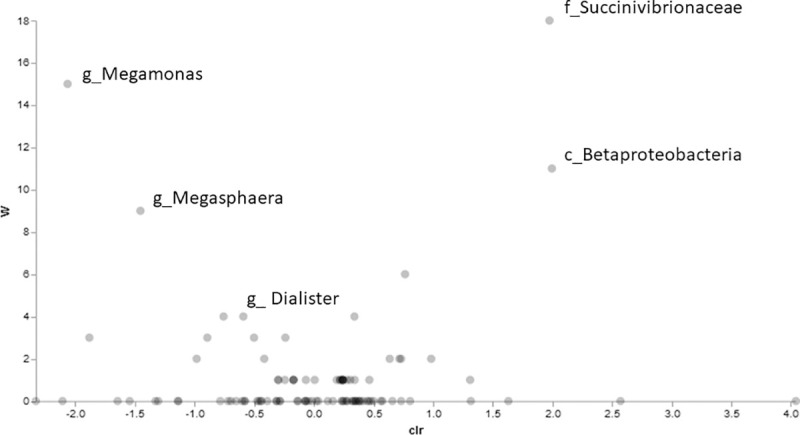
Fig 6. Differentially abundant microbial taxa identified by Analysis of Composition of Microbiomes (ANCOM).

Volcano plot of differential abundance comparing kittens prior to versus after experimental infection with T. foetus. Clr (x-axis) is a measure of the effect size difference for a particular species between the two conditions. The W-statistic (y-axis) is the strength of the ANCOM test for the tested number of species.
