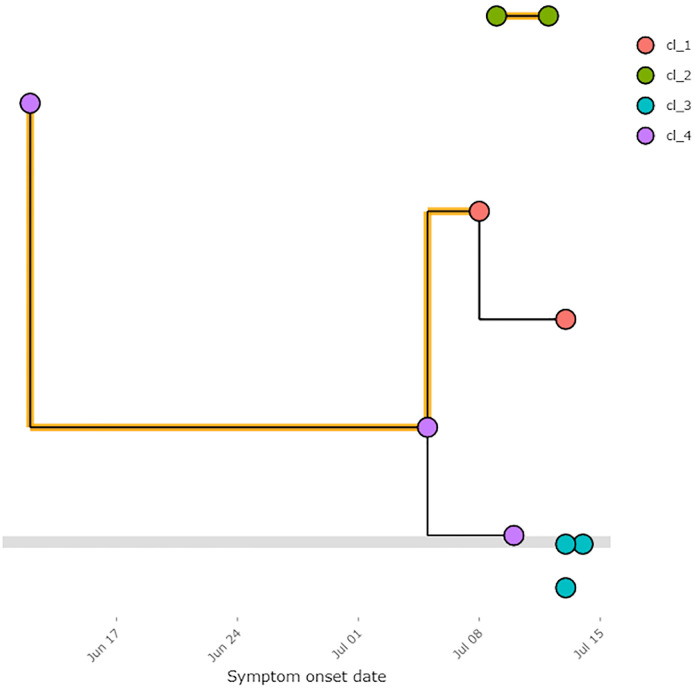
Fig 1. Basic transmission tree with symptom onset dates as entered.
These are visualised using the online shiny app using data from the template. Note, the colour of the node can depend on any entered field from the linelist, as specified by the user, in this example it depends on the cluster number. This example is available to download in templates from the online shiny application.

