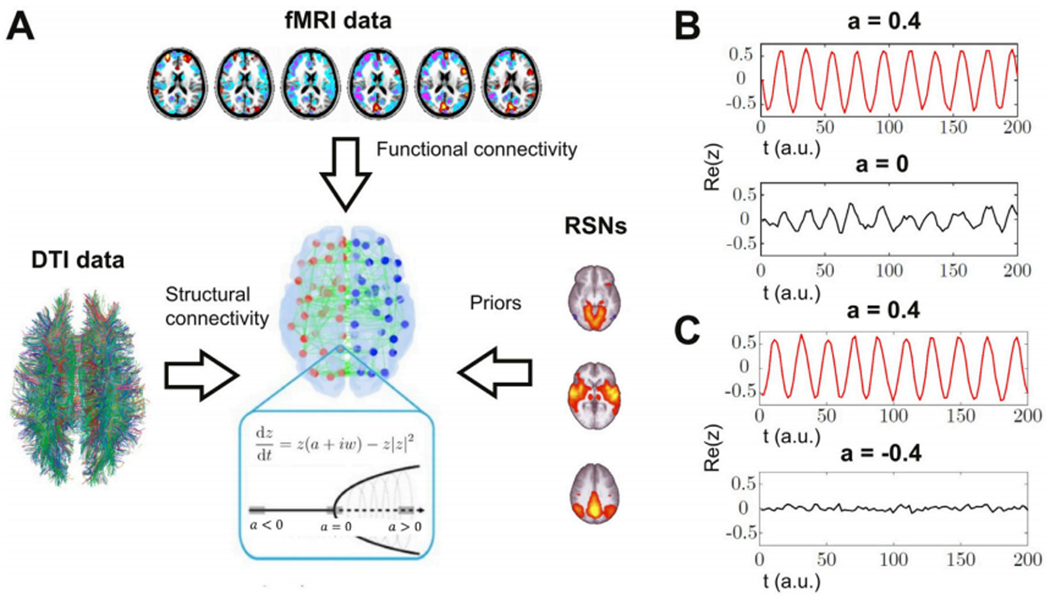
Fig. 1.

Procedure followed to construct the whole-brain model and a simplified example of the dynamics of two coupled oscillators. A) The model incorporates DTI data to define the SC between the non-linear oscillators, fMRI data to determine the intrinsic oscillation frequency of each node and the empirical FC that is fitted in the simulations, and RSNs as an anatomical prior to define the groups of nodes that contribute independently to the local bifurcation parameters. Dynamics are given by the normal form of a supercritical Hopf bifurcation (the equations and bifurcation diagram are provided in the inset). B-C) Example of two coupled oscillators with different bifurcation parameters. Panel B shows how oscillatory dynamics (a > 0) can induce oscillations in a critical node (a = 0) due to their coupling, while panel C shows that noisy dynamics at the fixed point (a < 0) prevents the synchronization with the oscillating node (a > 0). Re(z) stands for the real part of the simulated time series, which corresponds to the modeled fMRI signal.
