
Fig. 3.
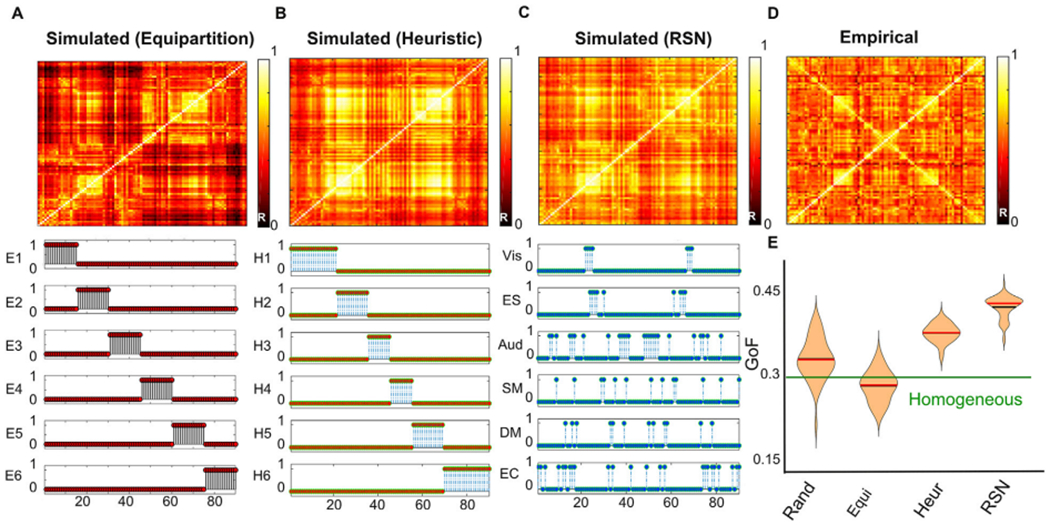
FC matrices obtained from the whole-brain model fitted to empirical FC using the equipartition prior (panel A), heuristic prior (panel B) and the RSN prior (panel C) present GoF value respectively GoFW,E = 0.29, GoFW,H = 0.38 and GoFW,RSN = 0.43 comparing with the empirical FC matrix (panel D). The bottom part of all panels shows the indicator function 1Gj (i) of Eq. (3), signaling the group membership of node i. The empirical FC matrix is displayed in panel D. As shown in panel E, the best TFF is obtained using the RSN prior, followed by the heuristic prior. Black and red horizontal lines indicate the mean and the median of the distribution. The horizontal green line stands for the best GoF obtained with the exhaustive homogeneous exploration.