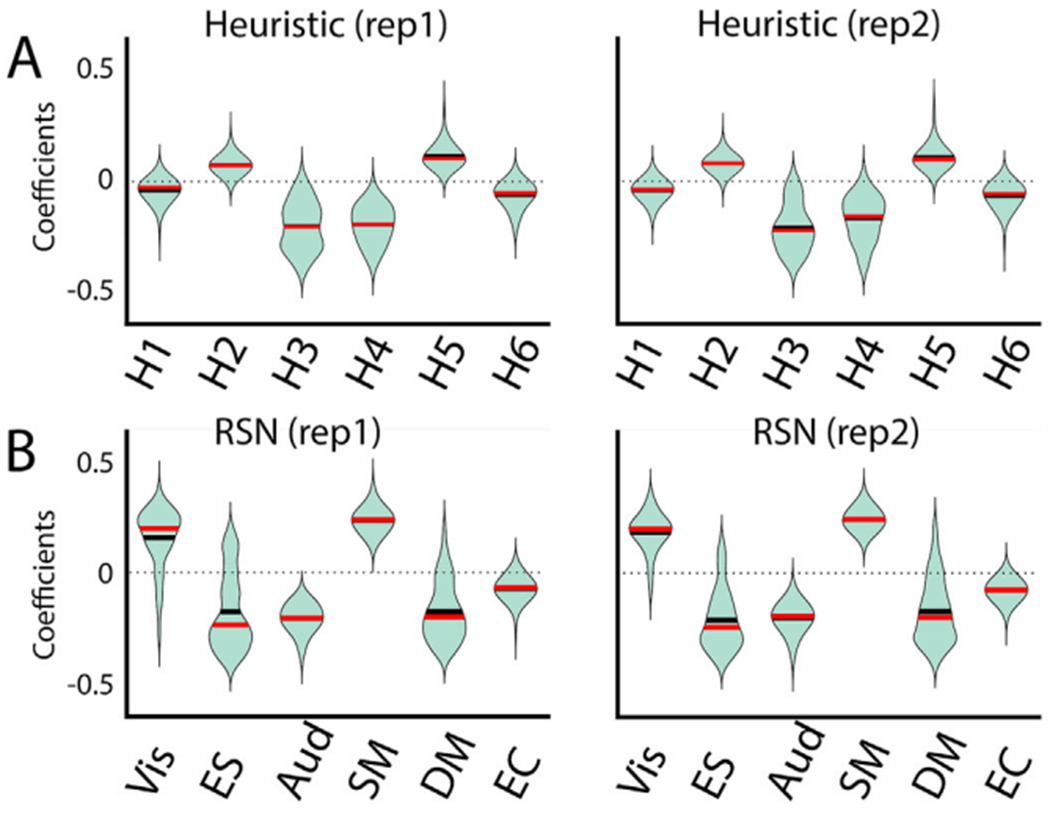
Fig. 4.

Coefficient distributions for 100 independent runs of the optimization procedures, for each group of nodes yielding the optimal GoF between simulated and empirical FC for the heuristic prior (panel A) and the RSN prior (panel B). Two sets (left and right) of 100 runs of optimization algorithm and are shown to highlight the convergence of the model parameters along repetitions (see Fig S5 to more repetitions). Black and red horizontal lines indicate the mean and the median of the distribution.
