
Fig. 9.
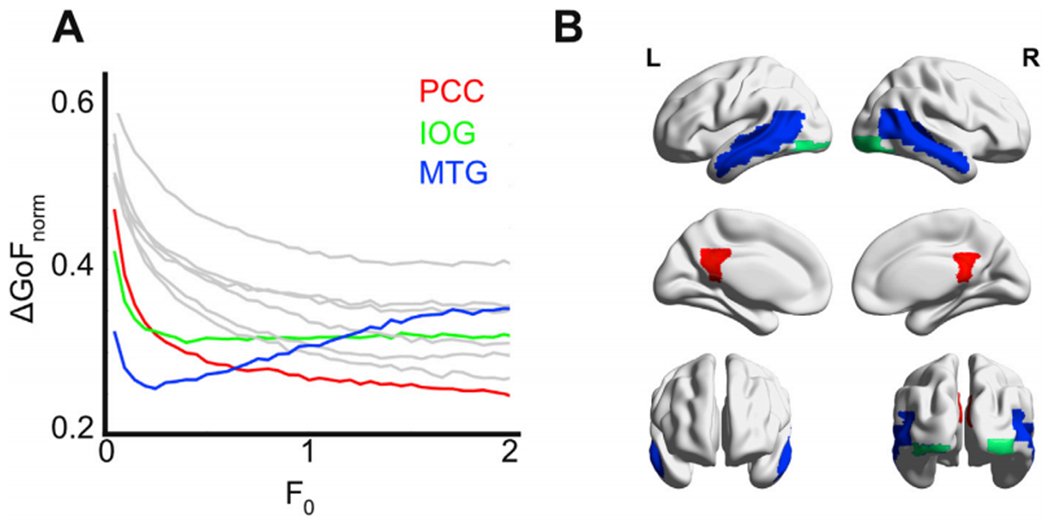
In silico stimulation of the model fitted to deep sleep using an additive oscillatory forcing term. A) ΔGoFnorm against the forcing amplitude F0 for the 10 pairs of nodes leading to the lowest ΔGoFnorm values. B) Rendering of the three regions presenting the lowest ΔGoFnorm. The color code indicates three different qualitative behaviors as F0 is increased: ΔGoFnorm decreases as a function of F0 (posterior cingulate cortex [PCC], shown in red), ΔGoFnorm achieves an optimal value and then increases as a function of F0 (middle temporal gyrus [MTG], shown in blue), and ΔGoFnorm remains approximately constant as a function of F0 (inferior occipital gyrus [IOG], shown in green).