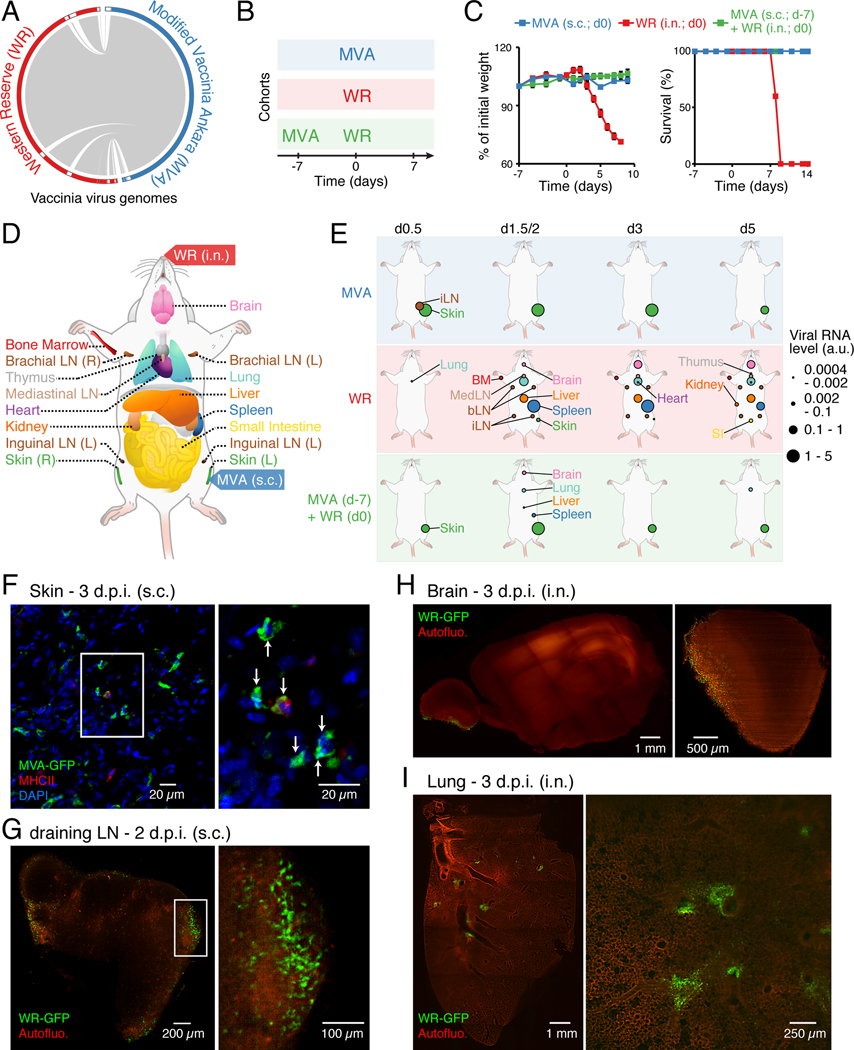
Figure 1. Dynamics of viral spread at the whole-organism scale.
(A) Viral genome alignment. Grey lines depict shared sequences. White boxes in the outer circle show genomic regions absent in the other strain.
(B-C) Cohorts of mice used to track vaccinating (MVA subcutaneously; s.c.), lethal (WR intranasally; i.n.) and protective (MVA followed by WR) responses (B), and matching weight (C, left) and survival (C, right) measurements. Error bars, SEM (n = 5).
(D) Schematic depicting the mouse tissues collected in this study (17 total including blood, not shown).
(E) Organismal viral spread for indicated cohorts and times post-infection (top). Circle sizes, normalized expression for viral gene E3L (encoded by MVA and WR).
(F-I) Whole-mount tissue imaging of skin (F), draining lymph node (inguinal; G), brain (H), and lung (I) at 2 or 3 day post-infection (d.p.i.) using indicated GFP-expressing virus strains and routes of infection. For skin (F) and dLN (G), insets indicate position of images on the right. For skin (F), MHC class II and nuclei (DAPI) were stained, and arrows indicate MVA-GFP+ cells. For brain (H) and lung (I), shown are tiled images (left), and representative sections (right). Autofluo., autofluorescence.

