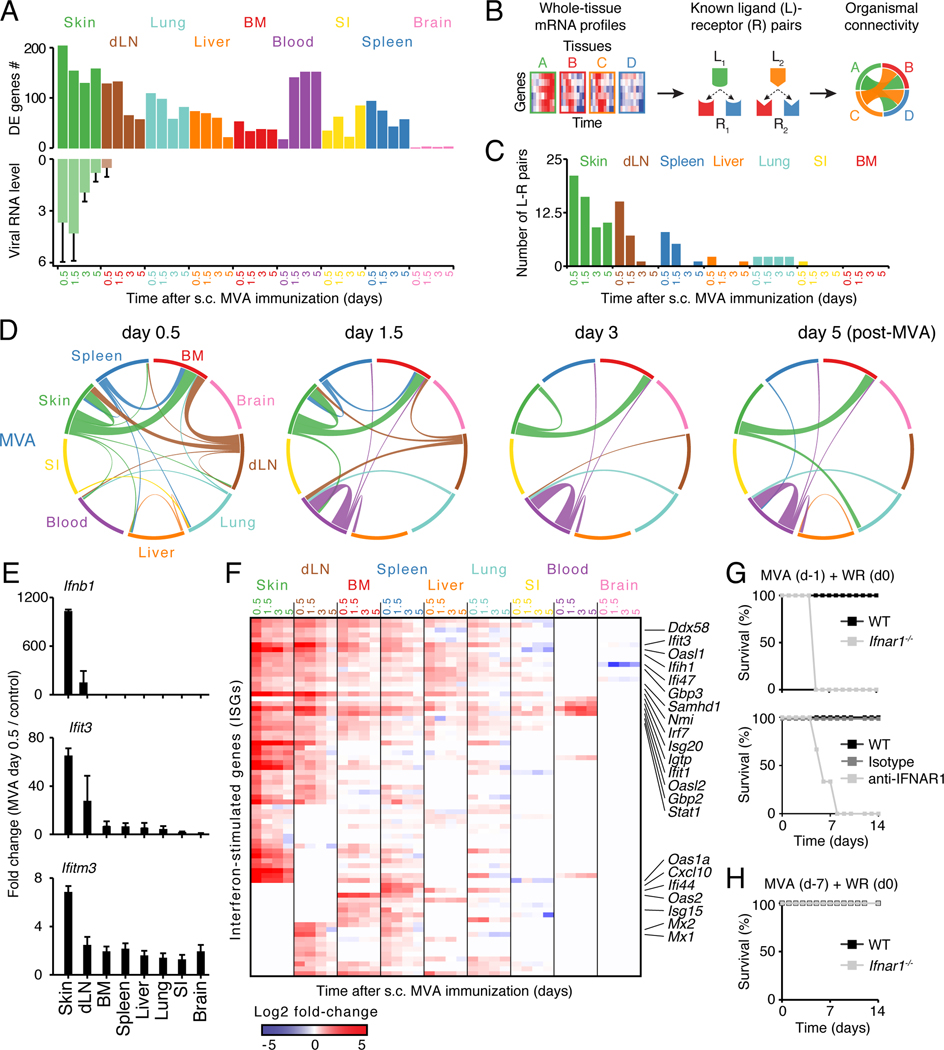
Figure 3. Analysis of ligand-receptor connectivity across tissues reveals a whole-body antiviral state.
(A) Bar graphs showing numbers of differentially expressed (DE) genes (top) and RNA levels of Vaccinia virus gene E3L (qPCR; bottom). Error bars, SD.
(B) Schematic overview of the analysis for ligand-receptor pair connectivity across tissues. Known ligand-receptor pairs were extracted from whole-tissue mRNA profiles and their potential links within and between tissues visualized using a circos plot.
(C) Bar graph showing the numbers of ligand (L)-receptor (R) pairs emanating from indicated tissues upon MVA immunization (s.c., subcutaneous).
(D) Inter-organ connectivity of ligand-receptor pairs at indicated times after MVA immunization. Line color, tissue source for ligands; line thickness, number of ligand-receptor pairs.
(E) Bar graphs showing fold changes between MVA-infected and control tissues for Ifnb1 and two ISGs: Ifit3 and Ifitm3 (qPCR). Error bars, SD (n = 4).
(F) Heatmap of all interferon-stimulated genes (ISGs) regulated across tissues upon skin MVA vaccination. Shown are log2 fold-change values relative to matching, uninfected tissues (FDR-adjusted p-value < 0.05 and absolute fold change > 2, n = 4).
(G-H) Survival analysis of wild-type (WT), anti-IFNAR1 or isotype antibody-treated, and Ifnar1−/− mice immunized subcutaneously with MVA at 1 (G) or 7 (H) days prior to intranasal WR challenge. Data are representative of three independent experiments.

