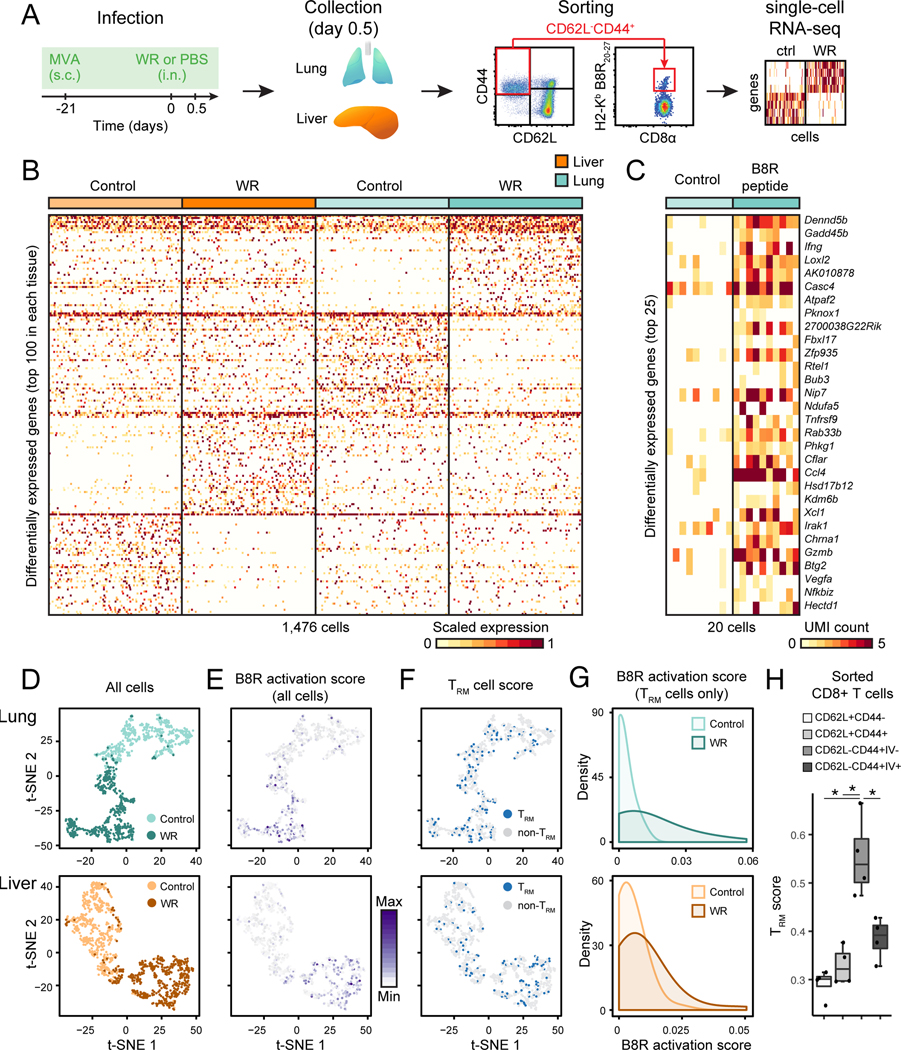
Figure 6. Tissue-resident memory CD8+ T cells are activated in lung and liver as virus spreads.
(A) Experimental workflow: mice were immunized with MVA at skin 21 days prior to intranasal WR challenge (or PBS as control) for 0.5 day, and single lung and liver memory CD8+ T cells (live CD3ε+CD44+CD62L− cells), including virus-specific cells were sorted by FACS prior to single-cell (sc) RNA-seq.
(B) Heatmap of 1,476 single memory CD8+ T cells (columns) from lung and liver showing the top 100 differentially expressed genes (rows) between control (PBS only) and WR-challenged mice in each tissue type (FDR < 0.01, expression fold change > 3).
(C) Heatmap of 20 single virus-specific (H2-Kb B8R20–27) CD8+ T cells (columns) showing the top 25 differentially expressed genes (rows) between cells from lungs of mice challenged with B8R20–27 peptide (20 μg) or saline as control (FDR < 0.01, expression fold change > 3). UMI, unique molecular identifiers.
(D-E) Impact of WR challenge on single CD8+ memory T cell states. Visualization of single cells from lung (top) and liver (bottom) from control (MVA vaccination only) and WR-challenged mice using t-SNE (D). t-SNE plots from D are shown in E and colored based on the B8R activation score (scaled average expression of genes differentially expressed in both WR (B) and peptide B8R20–27 (C) challenges).
(F-G) Tissue-resident memory CD8+ T cells (TRM) are activated in both lung and liver upon intranasal WR challenge. t-SNE plots from D are shown in F and colored based on the TRM cell score (scaled average expression of genes associated with the TRM phenotype). Blue dots indicate a TRM score > mean TRM score of all cells + 1 SD. In panel G are shown the distributions of B8R activation scores (E) in TRM cells (F).
(H) TRM scores for indicated CD8+ T cell populations sorted from lung after intravascular (IV) immunostaining. Error bars, SD (n = 4). *; Student’s t-test p-value < 0.05.

