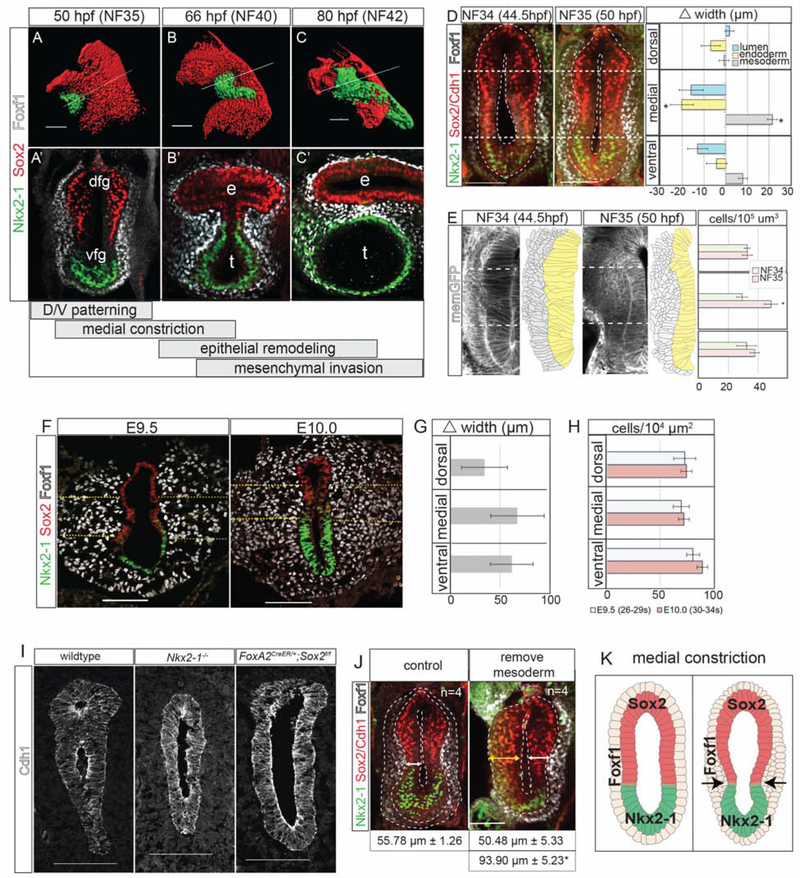
Figure 1: Foxf1+ Mesenchyme Promotes Medial Constriction at the Sox2-Nkx2–1 Boundary.
1A–C’: Immunostaining showing TE morphogenesis in Xenopus (X.) laevis. Scale bar, 100 μm.
1D: Medial constriction in X. laevis with quantification of the difference in foregut width between NF34 and NF35. Scale bar, 100 μm. Difference of means test,*p<0.5.
1E: Transgenic membrane-GFP X. laevis show increased medial mesenchyme cell density. Scale bar, 100 μm. Student’s two-tailed t-test,*p<0.05.
1F: Medial constriction mouse embryos showing. Dashed yellow lines denote medial mesoderm. Scale bar, 100 μm.
1G: Average change in mesoderm width between E9.5 and E10.0 was not significant. Difference of means test.
1H. Average mesoderm cell density at E9.5 and E10.0 was not significantly different. Student’s two-tailed t-test.
1I: Nkx2–1 and Sox2 mouse mutants (E10.5–E11) fail to undergo medial constriction. Scale bar, 100 μm.
1J: Removal of the lateral plate mesoderm prevents medial constriction in X. laevis embryos. Student’s two-tailed t-test between side without mesoderm, and either control embryos or the contralateral side.*p<0.05. Scale bar, 100 μm.
1I: Summary of medial constriction.

