Figure 1.

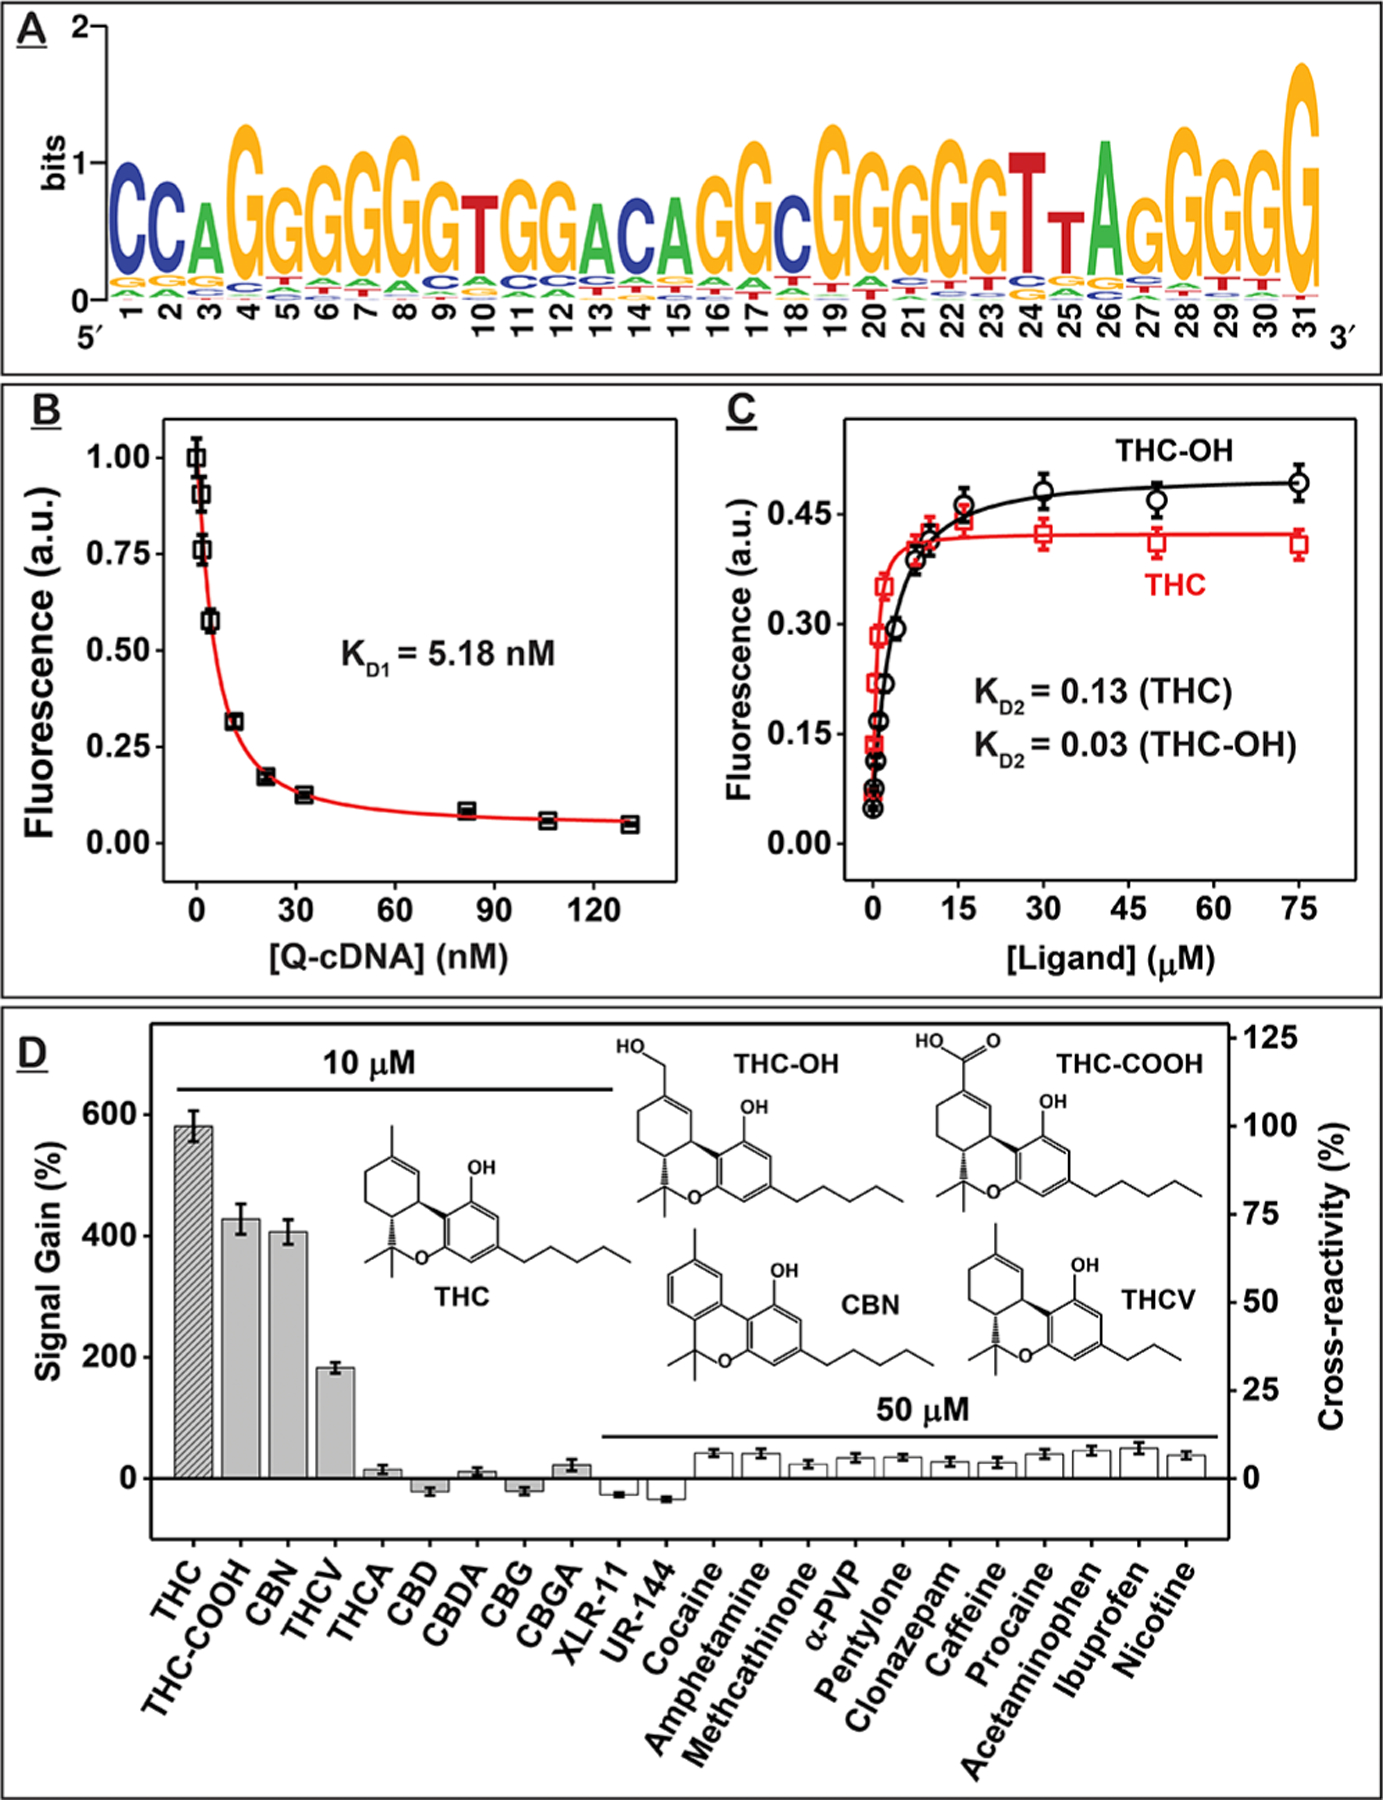
Identification and characterization of THC-binding aptamer THC1.2. (A) Sequence logo for the 44 clones obtained from the round 11 pool showing the nucleotide diversity at each position of the random domain. A larger font size represents higher frequency. (B–D) Strand-displacement fluorescence assay for determining the affinity and specificity of THC1.2. (B) KD1 was determined by titrating different concentrations of Iowa Black RQ-labeled complementary DNA strand (Q-cDNA) into Cy5-labeled THC1.2 (F-THC1.2) and measuring fluorescence quenching at 668 nm. (C) KD2 was determined from fluorescence recovery at 668 nm of F-THC1.2–Q-cDNA complexes combined with varying concentrations of THC or THC-OH. (D) Signal gains produced by cannabinoids and interferents and their cross-reactivity relative to THC. Error bars represent the standard deviation of measurements from three individual experiments.
