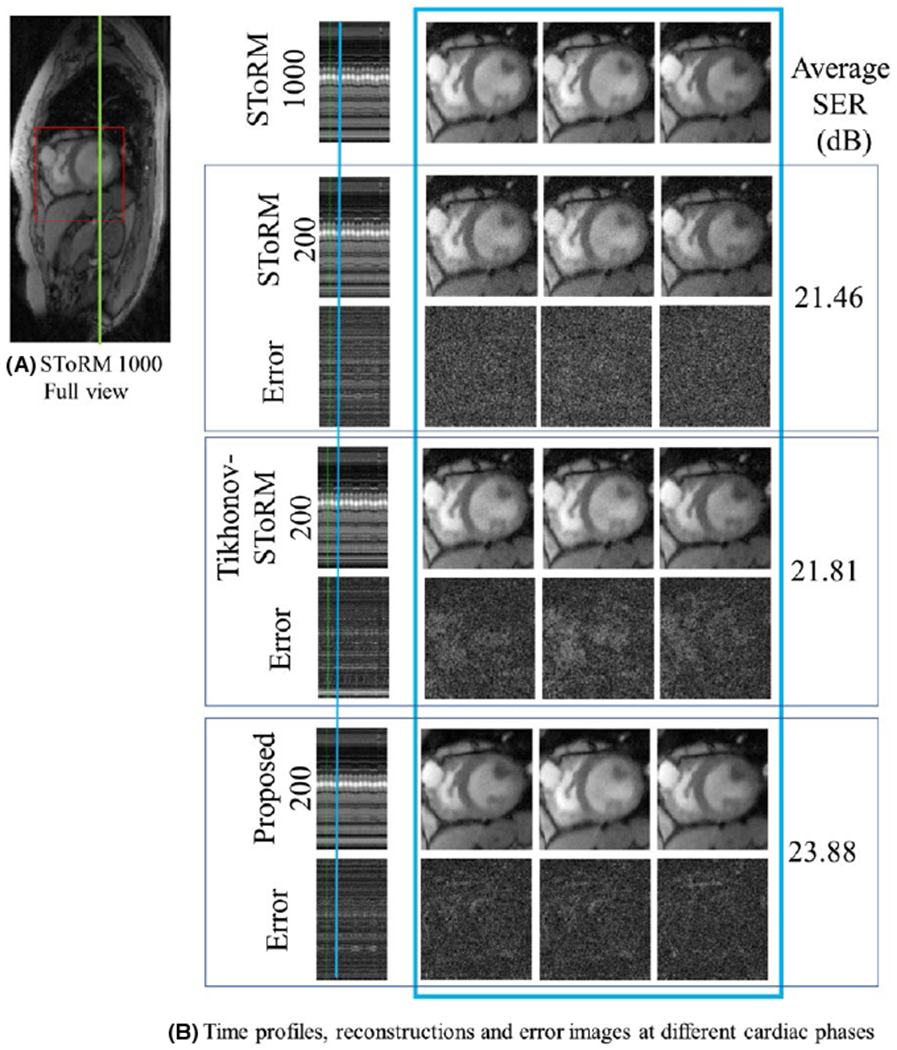
FIGURE 3.

Comparisons on Dataset 1: A, Full view of a single frame from the SToRM reconstruction using 1000 frames. Only (red) cropped myocardium region is shown. B, Top row: SToRM reconstruction using 1000 frames. Following six rows are three sets of competing reconstructions and corresponding error (w.r.t to top row) images: (i) SToRM reconstruction with 200 frames, (ii) Tikhonov-SToRM reconstruction with 200 frames and (iii) proposed with 200 frames. First column is the time profile along a vertical cut across the myocardium shown in green in (A). Following three columns show three cardiac states at one respiratory stage. The positions of the respiratory stage is marked blue on the time profile, in the first column. Three cardiac states are neighboring frames near the marked time point. The SER (dB) reported in the figure corresponds to the myocardium area
