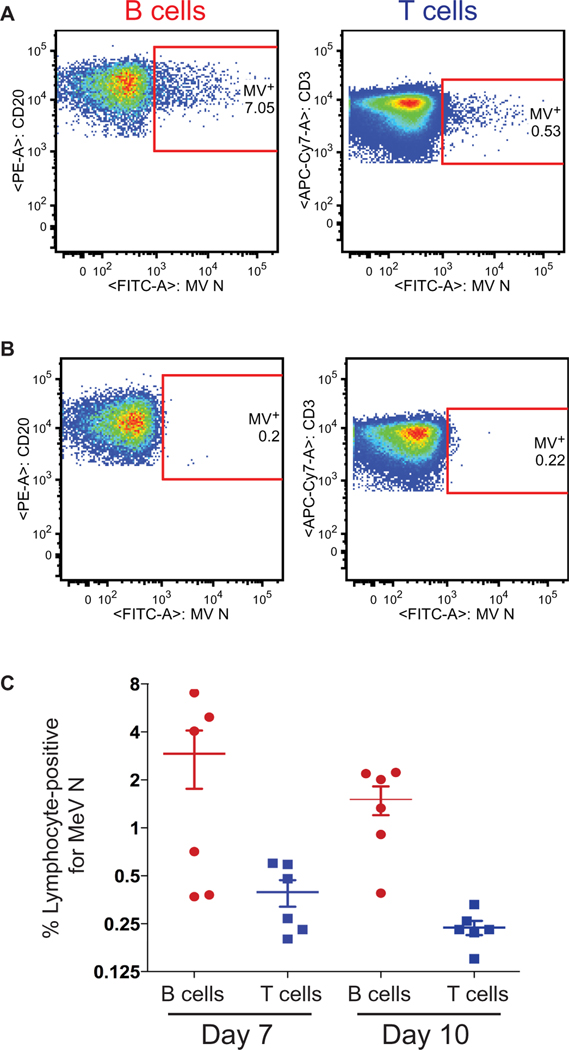
Fig. 2. Macaque PBMC subsets infected by WT MeV during viremia.
Flow cytometry was used to identify PBMCs expressing MeV N protein during viremia after intratracheal infection of macaques with 104 TCID50 of WT MeV. Representative flow cytometry images are shown for MeV N protein–expressing CD20+ B cells and CD3+ T cells from WT MeV–infected macaques 7 days after infection (A) and from uninfected control macaques (B). PE, phycoerythrin; APC, allophycocyanin. (C) Per-centages of B cells (red circles) and T cells (blue squares) expressing MeV N protein 7 and 10 days after infection of macaques. Lines indicate the mean and SEM for each cell type and virus.

