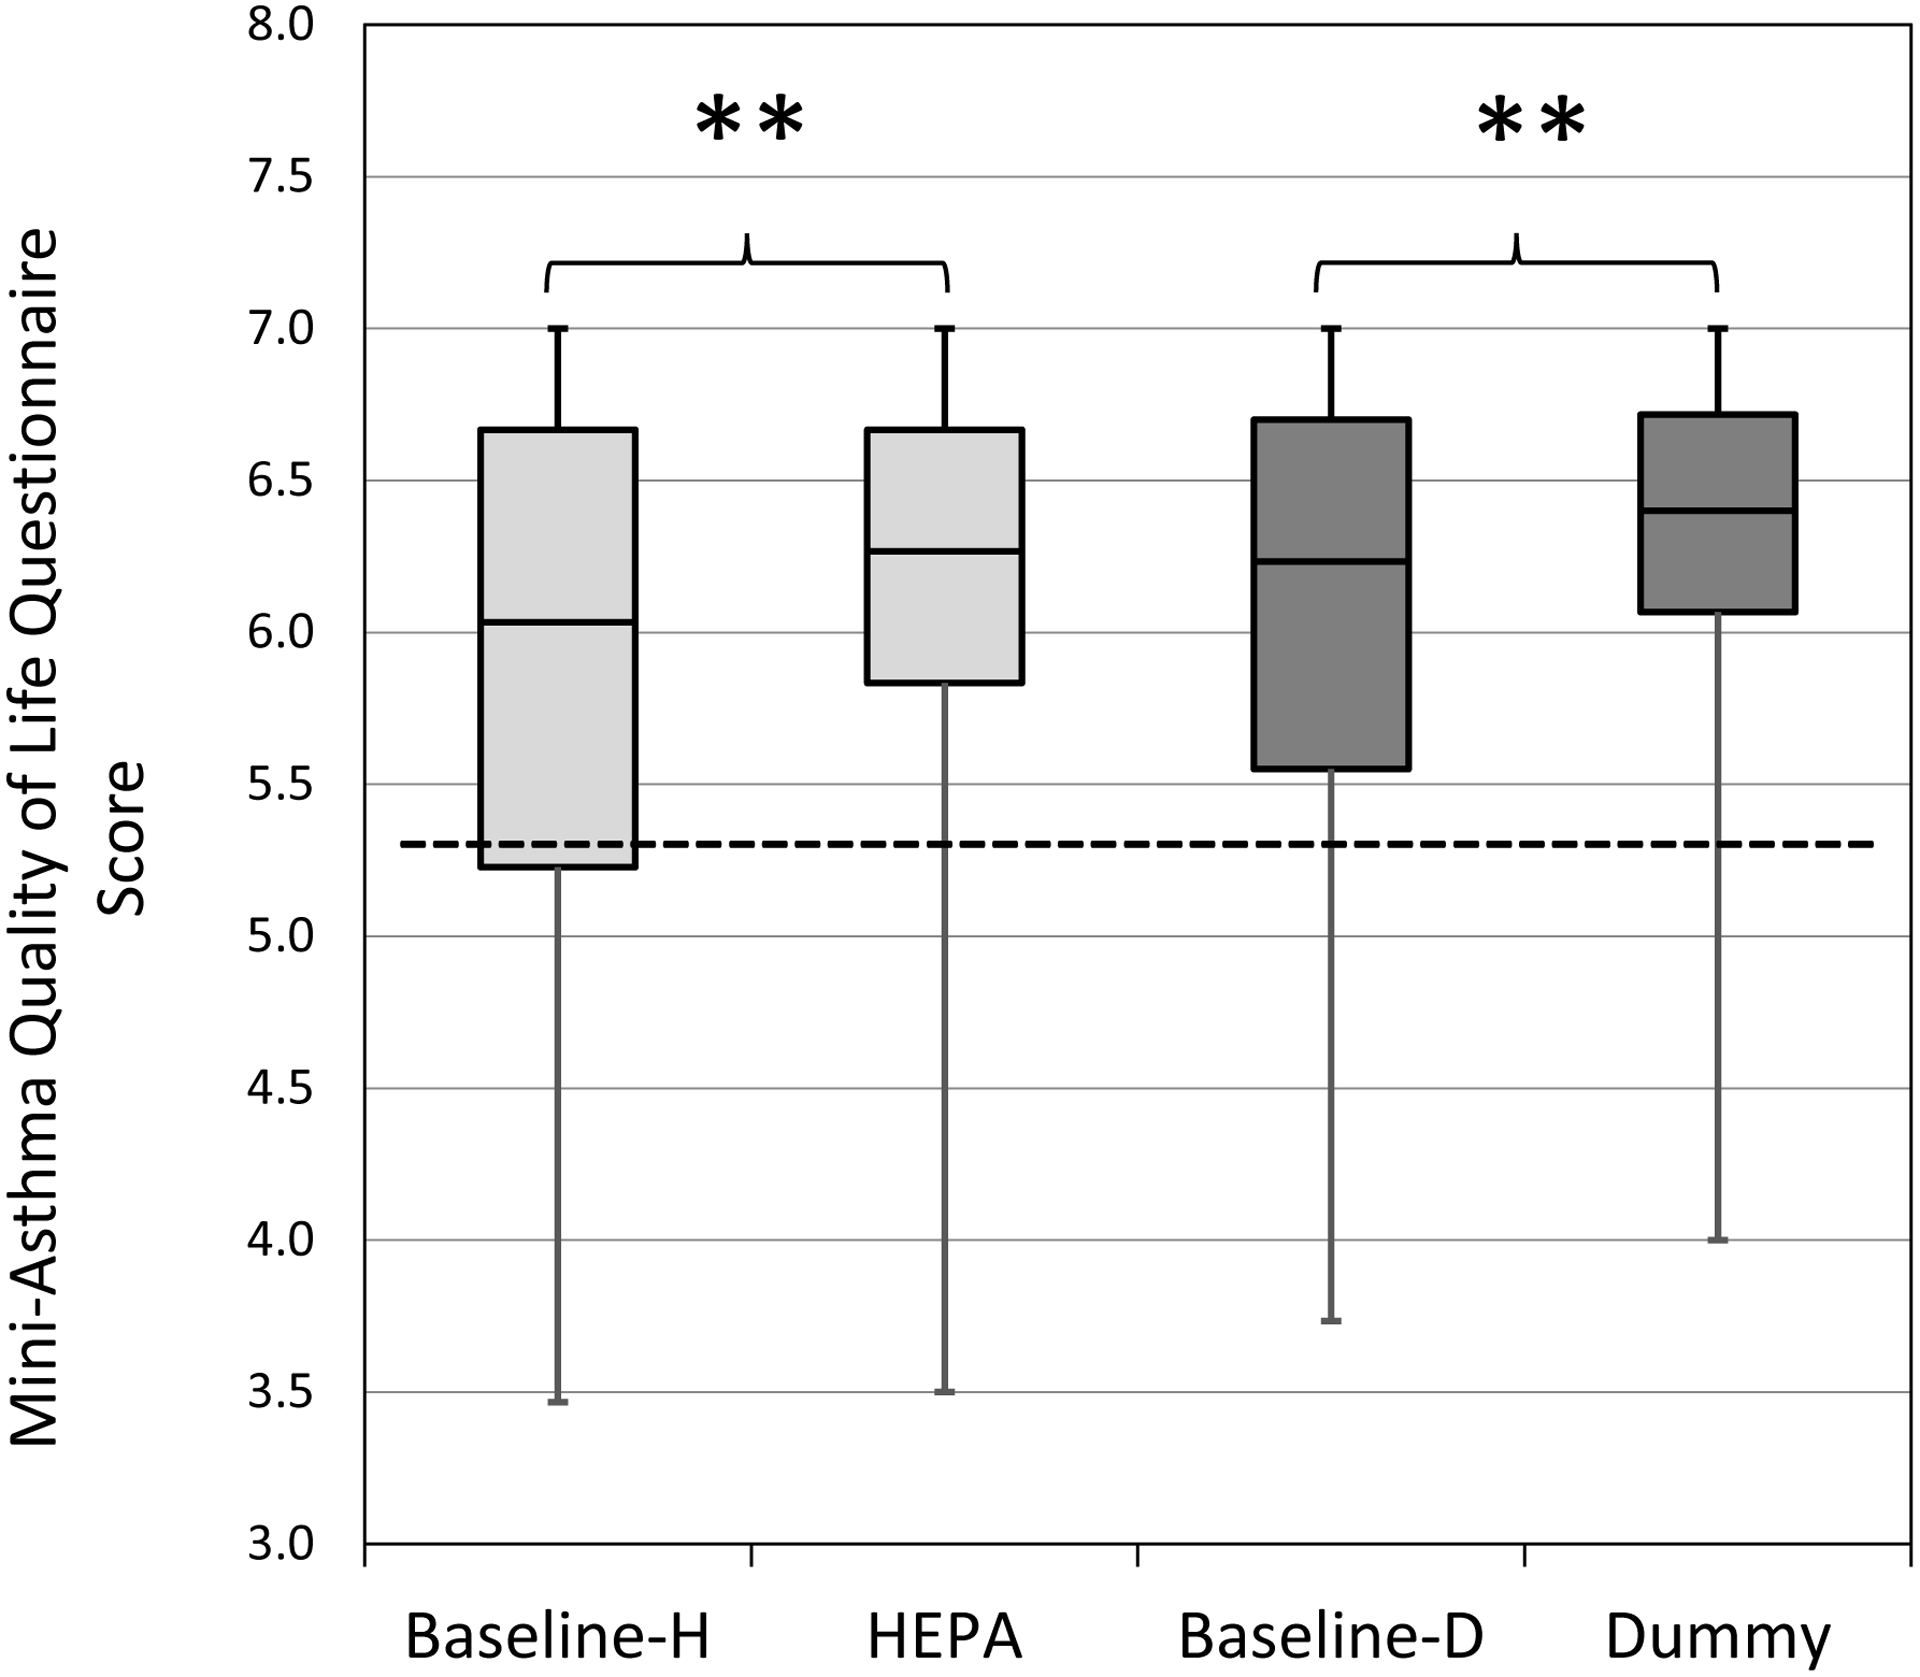
Figure 3. AQLQ (asthma quality of life questionnaire) scores by intervention for all participants (n=42).

Horizontal lines in the box plots represent the minimum, 25%, 50%, 75% percentiles, and maximum. The cut-off point for ‘adequate’ quality of life is ≥5.40 (dotted lined). H-HEPA. D-Dummy. **Due to Bonferroni adjustment, p-value <0.025 was considered significant.
