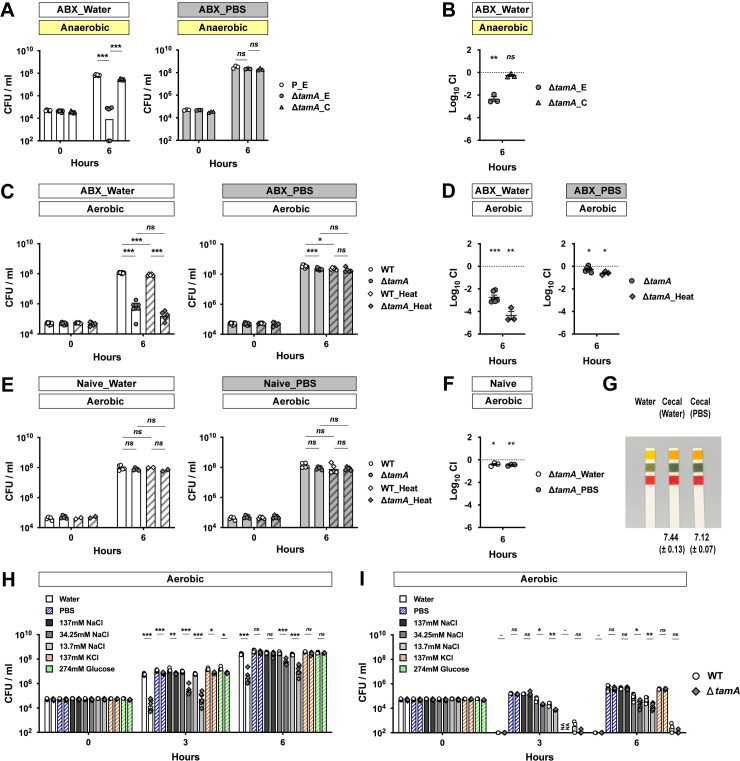
Fig 1. ΔtamA growth is reduced in cecal filtrates from antibiotic-treated mice under low osmotic stress.
(A) A wild type strain harboring an empty pACYC177_aadA plasmid (P_E) and ΔtamA harboring either an empty pACYC177_aadA plasmid (ΔtamA_E) or a complementary plasmid, pTam, (ΔtamA_C) were mono-cultured anaerobically in either water- or PBS-suspended cecal filtrates from antibiotic-treated mice. In the water-suspended cecal filtrate, the growth of ΔtamA_E was significantly delayed compared to wild type while the growth defect was corrected in ΔtamA_C. In contrast, growth of all three strains was comparable in the PBS-suspended cecal filtrate. (B) Wild type (P_E) and one of the ΔtamA strains (ΔtamA_E or ΔtamA_C) were co-cultured in water-suspended cecal filtrate from antibiotic-treated mice. (C, D) Aerobic growth of wild type and ΔtamA strains was compared in cecal filtrates from antibiotic-treated mice after heat inactivation by autoclaving: (C) mono-culture; (D) co-culture. (E, F) Wild type and ΔtamA strains were (E) mono-cultured or (F) co-cultured in water- or PBS-suspended cecal filtrates from naïve mice. (G) Water-suspended cecal filtrates from antibiotic-treated mice were slightly more basic than those suspended in PBS. pH of water-suspended cecal filtrates from antibiotic-treated mice (n = 4) was measured using a pH meter and mean pH ± SD values are noted. The shown pH paper image was taken for visualization from one of the experiments. (H, I) Wild type (white circles; the left of each bar graph pair) and ΔtamA (grey rhombuses; the right of each bar graph pair) strains were mono-cultured (H) in cecal filtrates from antibiotic–treated mice, suspended with water, PBS, 137 mM NaCl, 34.25 mM NaCl, 13.7 mM NaCl, 137 mM KCl, or 274 mM glucose, or (I) in the diluents (water, PBS, 137 mM NaCl, 34.25 mM NaCl, 13.7 mM NaCl, 137 mM KCl, or 274 mM glucose solutions). For each round of experiments, the same inoculum batch was used for (H) and (I). NA, data not available. (A, C, E, H, I) Bar graphs represent geometric means. (B, D, F) Mean ± SEM of log10CI (competitive index) is shown.–, p value not available; ns, not significant; *, p < 0.05; **, p < 0.01; ***, p < 0.001, by (A, C, E, H, I) unpaired multiple t test or (B, D, F) one-sample t test on log10 transformation. For a better sterility and feasibility, some experiments were performed in aerobic conditions (C–I).

