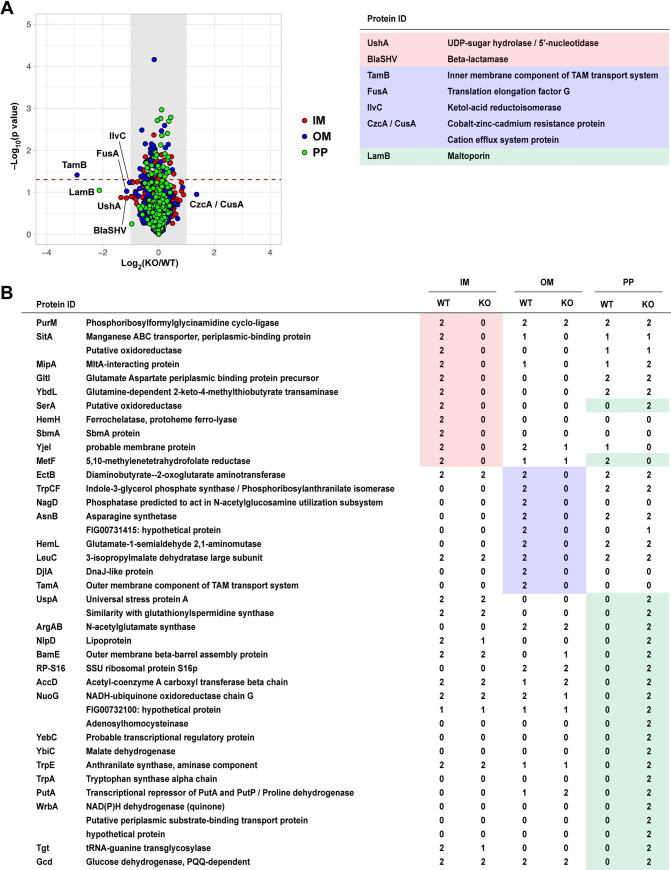
Fig 3. Abundance of a subset of proteins is altered in ΔtamA while overall protein profiles are conserved.
(A) Protein profiles of inner membrane (IM), outer membrane (OM), and periplasmic (PP) fractions from wild type and ΔtamA strains were assessed by LC-MS/MS (see Materials and Methods for details), and average fold changes in proteins (ΔtamA/wild type) and p-values by one sample t-test are plotted in a log2 and log10 scales, respectively. The proteins detected in each sub-fraction are highlighted with colors: red, the IM fraction; blue, the OM fraction; green, the PP fraction. The grey shades mark the fold change cut-off of 2 and proteins that showed more than 2-fold changes in average are listed on the right. The dashed line indicates p-value of 0.05. Fold changes and p-values of all the plotted proteins can be found in S1 Table. (See also S7 Fig). Raw data of the LC-MS/MS analysis is available in S1 Data. (B) The list of proteins that were exclusively detected in either wild type or ΔtamA. The same color scheme to (A) is applied. The numbers (0–2) indicate the number of replicates in which the given protein is detected. For example, in the IM fraction, PurM was detected in wild type (WT) in both replicates (“2”) but not in ΔtamA (KO) in either replicate (“0”). The proteins listed here are not included in (A)—the fold changes cannot be calculated if proteins are not detected in either wild type or ΔtamA samples. (See also S2 Table).

