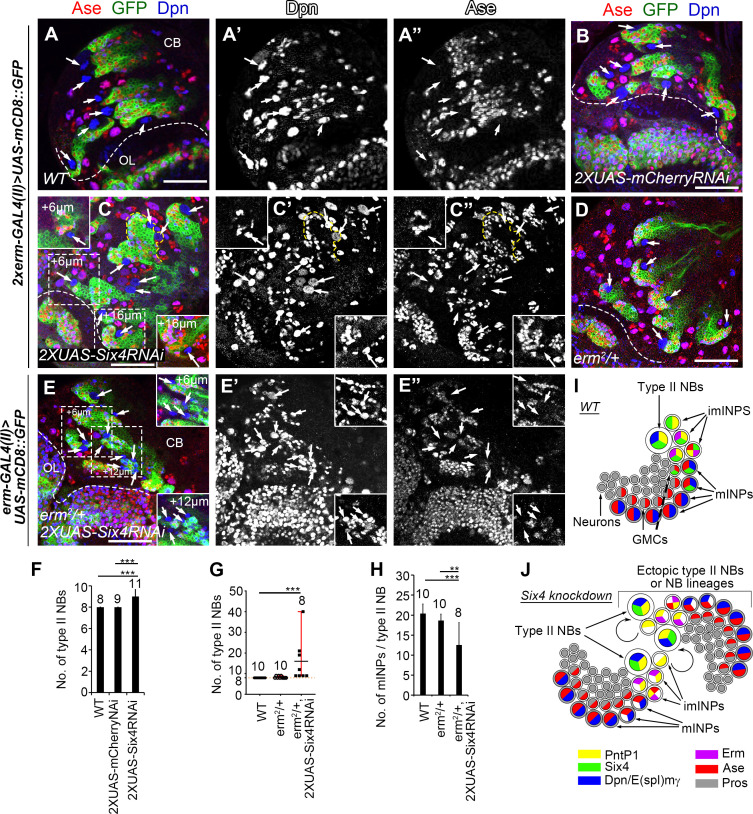
Fig 3. Knockdown of Six4 in imINPs leads to an increased number of type II NBs.
In all images, type II NB lineages were labeled with mCD8-GFP driven by erm-GAL4 (II) and counterstained with anti-Dpn and anti-Ase antibodies. Arrows point to type II NBs that express Dpn but not Ase. Note that type II NBs are not labeled by mCD8-GFP driven by erm-GAL4 (II). Dashed lines demarcate the boundary between the central brain (CB) and the optic lobe (OL). Scale bars equal 50μm. (A-A”) A wild type brain lobe contains eight type II NBs. (B) Expression of two copies of UAS-mCherry RNAi driven by two copies of erm-GAL4(II) does not generate any ectopic type II NBs. (C-C”) Expressing two copies of UAS-Six4 RNAi driven by two copies of erm-GAL4(II) results in extra type II NBs. Insets show two additional type II NBs at different focal planes from the areas highlighted with dashed squares. A single lineage with two type II NBs is outlined by a yellow dashed line. (D) An erm2/+ heterozygous mutant brain lobe has eight type II NBs. (E-E”) Knockdown of Six4 with two copies of UAS-Six4 RNAi in erm2/+ heterozygous mutant background results in generation of more extra type II NBs. Insets show additional type II NBs at different focal planes from the areas highlighted with dashed squares. (F-G) Quantifications of the number of type II NBs in the brains with indicated genotypes. The number on top of each bar represents the number of brains examined. ***, p < 0.001. (H) Quantifications of the average number of mINPs per NB in the brains with indicated genotypes. The number on top of each bar represents the number of brains examined. **, p < 0.01. ***, p < 0.001. (I) A schematic diagram shows the expression pattern of Six4 (green) in a type II NB lineage. (J) A schematic diagram shows that knockdown of Six4 leads to dedifferentiation of imINPs into type II NBs that establishes independent lineages.

