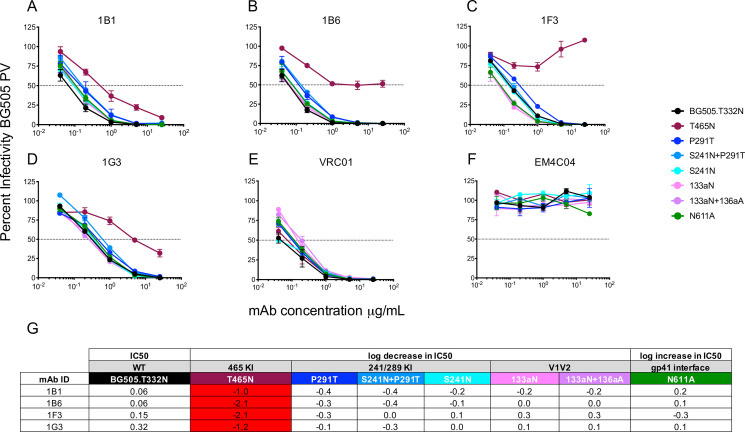
Fig 5. Mapping of mAb neutralizing activity.
Neutralizing activity against the parental BG505 and mutant PVs was evaluated using the TZM-bl assay in (A—F). The mAb is indicated above each graph, which displays percent infectivity plotted against mAb concentration in μg/ml. mAbs VRC01 (E) and EM4C04 (F) were used as positive and negative controls, respectively. (G) The log10 fold increase or decrease in IC50 titer of each mutant PV relative to the parental BG505 PV is shown. An increase in IC50 of greater than 0.5log10 is highlighted red.

