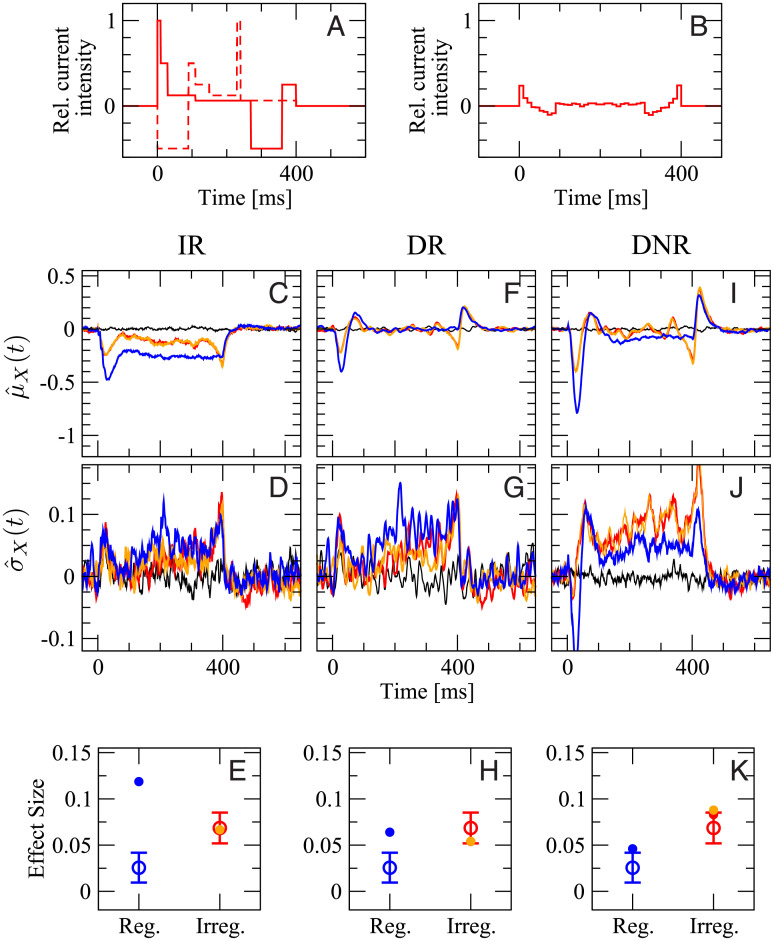
Fig 9. In the comparison irregular vs. regular stimulation, simulation results from DNR agree well with the experimental data, whereas results from the IR are most inconsistent with the data.
Blue lines and symbols refer to the 400 ms regular stimulus, as in the previous cases; Red and orange lines and symbols refer to two different random samples of 10000 irregular stimuli (two specific realizations are shown in A, the average stimulus is shown in B; for details see text). Black line is catch trial condition (no stimulus). First row (C,F,I): deviation from the spontaneous value of the time-dependent mean readout activity normalized by the spontaneous standard deviation, defined in Eq (13). Second row (D,G,J): deviation from the spontaneous value of the time-dependent standard deviation of the readout activity normalized by the spontaneous standard deviation, defined in Eq (16). Third row (E,H,K): average effect size. Open circles with error bars: experimental data (average over 62 RS cells and 1780 total trials); filled circles of corresponding color: model simulations. First column (C,D,E): IR. Second column (F,G,H): DR. Third column (I,J,K): DNR.

