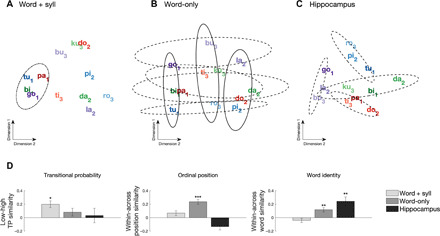
Fig. 2. Pattern similarity results during auditory SL.

Multidimensional scaling (MDS) of the distances between syllabic responses across electrodes showing significant (A) word + syll responses and (B) word-only responses, as well as (C) across electrodes from the hippocampus. Individual words are color-coded; subscripts represent ordinal position (e.g., “tu1pi2ro3”). Dot-dashed ellipses indicate grouping by TP, solid ellipses outline grouping by ordinal position, and dashed ellipses indicate grouping at the level of the individual words (color-coded). (D) Quantification of multivariate similarity for syllables in the auditory SL task. Left: Similarity by TP. Greater within-class similarity indicates stronger grouping of syllables with low TP (0.33) than syllables with high TP (1.0). A Friedman test indicated a main effect of electrode type on TP similarity (χ2 = 22.03, P < 0.001). Middle: Within versus between similarity for ordinal position. Greater within-class similarity indicates stronger grouping of syllables holding the same first, second, or third position in a word. A Friedman test indicated a significant main effect of electrode type (χ2 = 790.35, P < 0.001). Right: Within versus between similarity for word identity. Greater within-class similarity indicates grouping of syllables into individual words. A Friedman test indicated a significant main effect of electrode type (χ2 = 265.29, P < 0.001). ***P < 0.001 and **P < 0.01, Bonferroni-corrected Wilcoxon rank sum test; error bars denote the population SEM.
