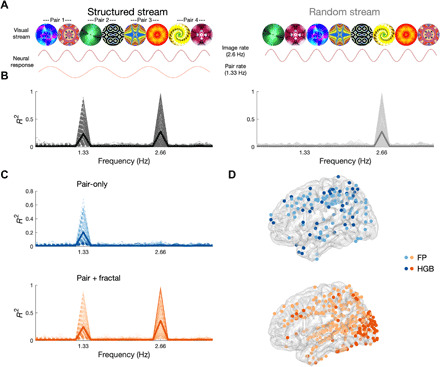
Fig. 3. Neural tracking of visual SL.

(A) Schematic depiction of the visual SL task. The structured stream (left) consisted of a continuous visual stream of eight fractals (375-ms SOA, 2.66 Hz). The TPs were adjusted to form four fractal pairs (750-ms SOA, 1.33 Hz). Note that the SOA of the fractals was elongated compared to the syllables to match the frequency of the learned units (pairs and words), given that there were two fractals per unit and three syllables. The random stream (right) contained the same fractals but in random order. The predicted neural responses are shown under each stream: Fractal tracking is expected for both streams, while pair tracking is expected for the structured stream only. (B) Phase coherence spectrum in neural data for the structured (left, black) and random (right, gray) conditions from 1606 electrodes in 12 patients. Each significant electrode is depicted with a thin line, and the average across the population is depicted with a thick line. (C) Phase coherence spectrum in the structured condition for electrodes showing pair-tracking responses, in two sets: electrodes that tracked pairs only (left, blue) and electrodes that tracked pairs and fractals (right, orange). (D) Localization of pair-only (top, blue) and pair + fractal (bottom, orange) electrodes exhibiting significant phase coherence in the FP (light blue, light orange) or HGB (dark blue, dark orange).
