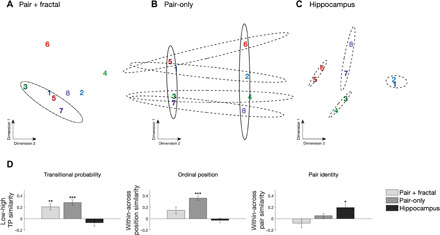
Fig. 4. Pattern similarity results during visual SL.

MDS of the distances between responses to individual fractals across (A) pair-only, (B) pair + fractal, and (C) hippocampal electrodes. Pairs are color-coded; odd numbers refer to the first position, and even numbers refer to the second position. Dot-dashed ellipses outline grouping by TP/ordinal position in pair + fractal electrodes. Solid ellipses outline grouping by TP/ordinal position in pair-only electrodes. Dashed ellipses indicate grouping by pair in pair-only and hippocampal electrodes. (D) Comparison of multivariate pattern similarity for fractals in the visual SL task. Left: Within versus between similarity for low versus high TP. Greater within-class similarity indicates stronger grouping of fractals with a low TP (0.33) over fractals with a high TP (1.0). A Friedman test indicated a main effect of electrode type on TP similarity (χ2 = 19.3, P < 0.001). Middle: Within versus between similarity for ordinal position. Greater within-class similarity indicates grouping of fractals holding the same first or second position in a pair. A Friedman test indicated a main effect of electrode type (χ2 = 122.2, P < 0.001). Right: Within versus between similarity for pair identity. Greater within-class similarity indicates grouping of fractals into pairs. A Friedman test indicated a main effect of electrode type (χ2 = 40.04, P < 0.001). ***P < 001 and *P < 0.05, Wilcoxon rank sum test; error bars denote the population SEM.
