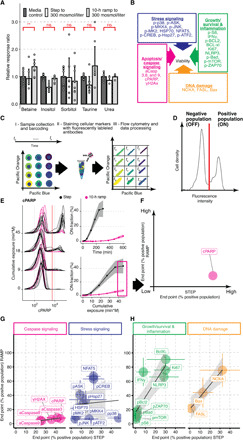
Fig. 2. Temporal functional quantitative flow cytometry screen identifies differential regulation of stress and caspase signaling during step and ramp hyperosmotic stress conditions.

(A) Mean response ratio of cellular osmolytes relative to media measured in Jurkat cells exposed to an additional 300 mosmol/liter NaCl and determined by mass spectrometry. Two-sided unpaired Student’s t test: **P < 0.01; ns, not significant. (B) Overview of protein markers in this study. (C) Multiplex flow cytometry workflow to quantify dynamic changes in protein activity over time. (D) Flow cytometry distribution is threshold-gated (red line). (E) Representative flow cytometry distributions for cleaved PARP (cPARP) at selected time points for step (black) and 10-hour ramp (magenta) experiments (left), positive cells (ON-fraction) over time (right, top), or cumulative NaCl exposure (right, bottom). Mean (solid line) and SD (shaded area) of >3 biological replicas. (F) End point measurement (magenta box in E) to determine ON-fractions to compare changes for step and ramp conditions. (G and H) Comparison of end point measurement for individual markers of groups as indicated in (B). Circles represent mean of ON-fractions after exposing cells for 5 hours (step) or 10 hours (ramp) to 300 mosmol/liter NaCl. N ≥ 3, colored lines represent SD. Black lines indicate linear regression fits. Shaded area represents 95% confidence interval.
