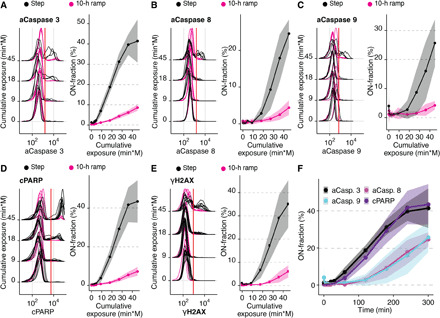
Fig. 3. Differential caspase signaling regulates cell viability.

(A to E) Differential regulation of (A) cleaved caspase 3, (B) cleaved caspase 8, (C) cleaved caspase 9, (D) cPARP, and (E) γH2AX in Jurkat cells exposed to 300 mosmol/liter NaCl by a step (black) or a 10-hour ramp (magenta). The left panel shows selected single-cell distributions over the cumulative exposure with individual lines representing independent experiments. Red line indicates the threshold for determining the ON-fraction. Right panels represent ON-fraction mean and SD of 3 to 10 independent experiments as a function of cumulative exposure of NaCl. (F) ON-fraction kinetics of caspase signaling markers over time indicate early (caspase 3 and cPARP) and late (caspase 8 and 9) activation. Lines indicate mean and SD of 3 to 10 independent experiments.
