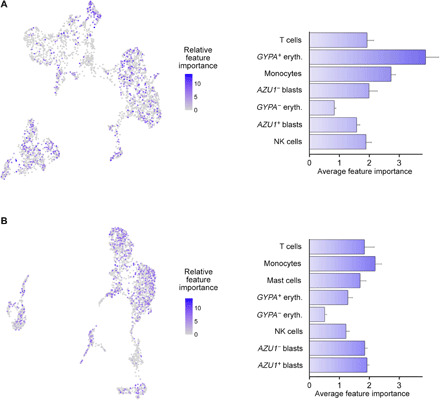
Fig. 4. Contribution of single-cell features across various cell types to the predictive modeling.

(Left) Relative importance of each single cell for the predictive contribution of the model, define by the features’ predictive contribution for each regression tree of the XGBoost algorithm. (Right) Average feature importance (AFI) of each cell type for generating the model predictions, calculated by averaging the feature importance within the cell types. (A) AML3_D and (B) AML_R. Higher AFI values indicate that higher percentage of cells within the cluster are distinct from each other and are required for more accurate predictions, while low AFI values imply that cells within a cell type are highly similar from the model perspective, and only few cells are enough for model construction. The error bars denote SEM of the scaled AFI.
