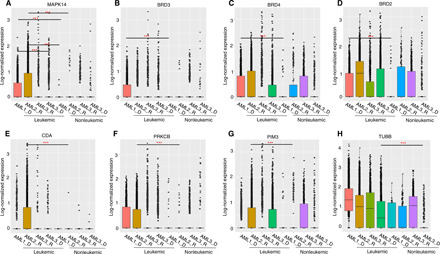
Fig. 5. Target expression of compounds identified as effective and less toxic combinations.

(A) Comparison of the expression of losmapimod primary target MAPK14 in the leukemic cells of AML1 and AML2 patients, against leukemic cells of AML3 patient, and nonleukemic cells of AML1 and AML2. (B to D) Comparison of expression levels of molibresib targets BRD2, BRD3, and BRD4 between leukemic and nonleukemic cells of AML1. (E) Comparison of the cytarabine-deactivating enzyme cytidine deaminase (CDA) expression in the leukemic cells of AML2 patient with leukemic cells of other samples and nonleukemic cells of AML2. (F and G) Comparison of the expression levels of ruboxistaurin targets PRKCB and PIM3 in the leukemic cells of AML2 patient with leukemic cells of other samples and nonleukemic cells of AML2. (H) Comparison of expression levels of patupilone target tubulin β (TUBB) in the leukemic cells of AML3 patient with leukemic cells of other samples and nonleukemic cells of AML3. In each panel, y axis shows log-normalized count values after sctransform (32), where P values were calculated with Wilcoxon rank sum test. ***P < 0.001.
